Notes and key-term cards for this topic are being written by our tutors. The past-paper questions below are ready now.
Learning outcomes
Show the 12 learning outcomes from the specification
3.2.2(a) the effect of concentration, including the pressure of gases, on the rate of a reaction, in terms of frequency of collisions
3.2.2(b) calculation of reaction rate from the gradients of graphs measuring how a physical quantity changes with time
3.2.2(c) explanation of the role of a catalyst:
3.2.2(c)(i) in increasing reaction rate without being used up by the overall reaction
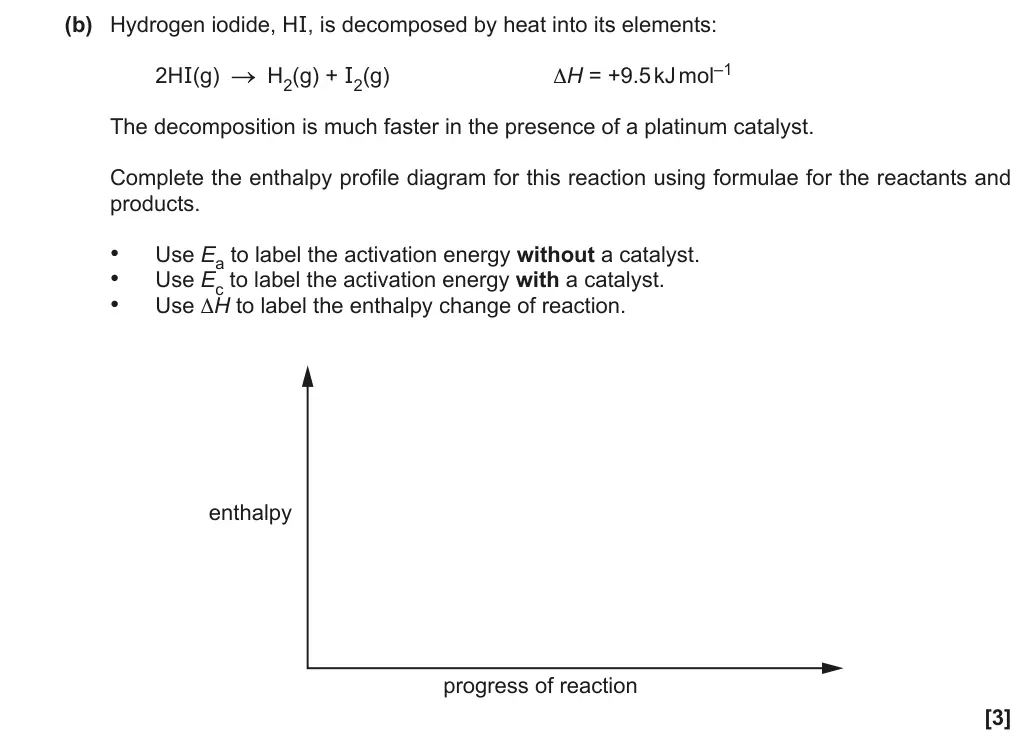
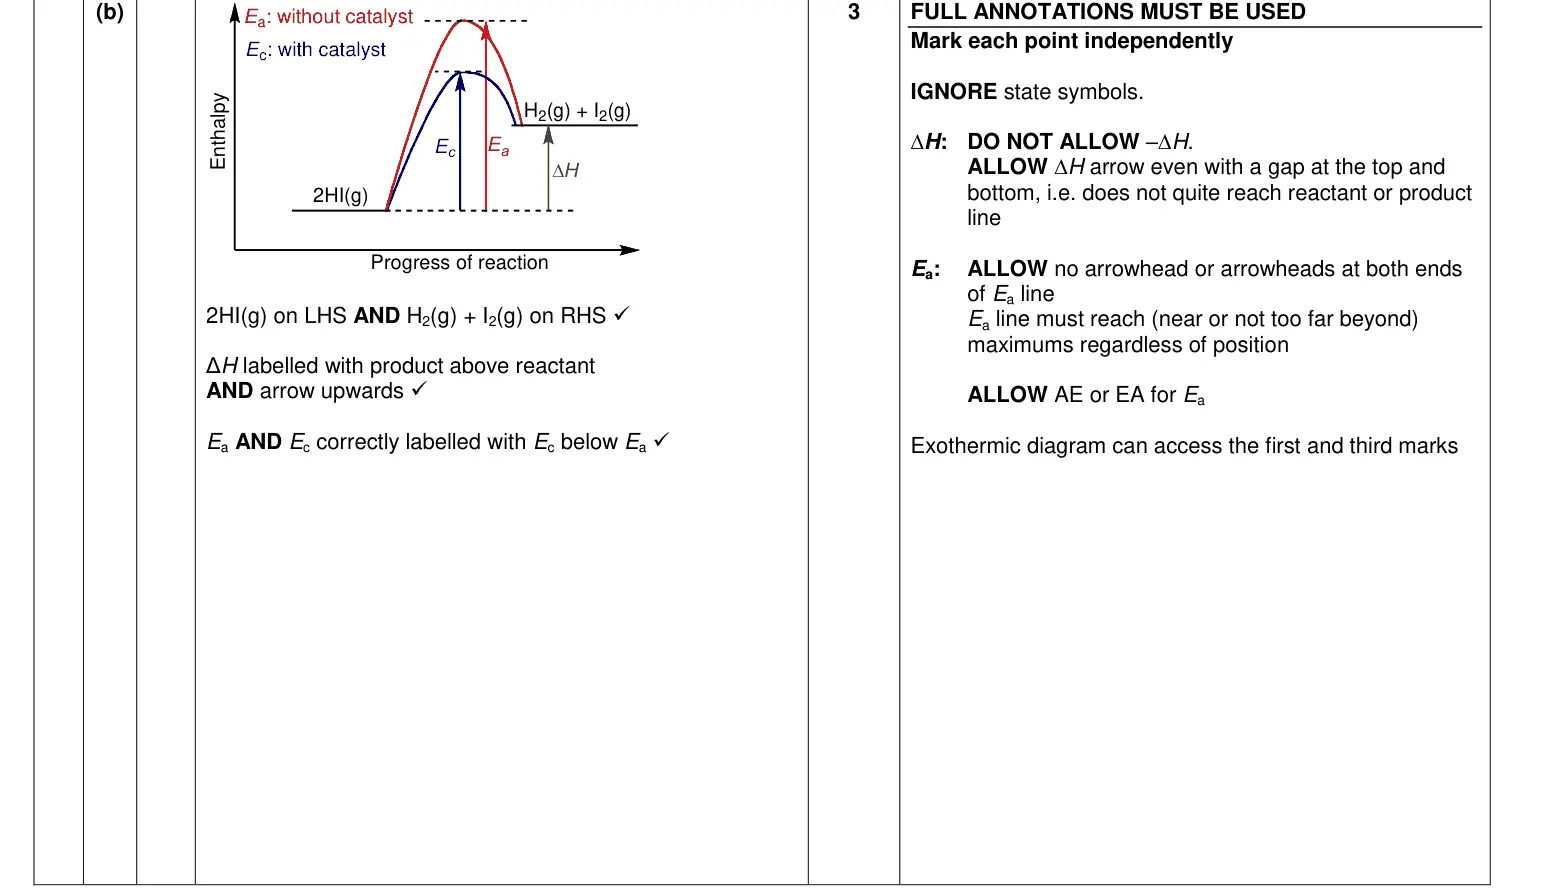
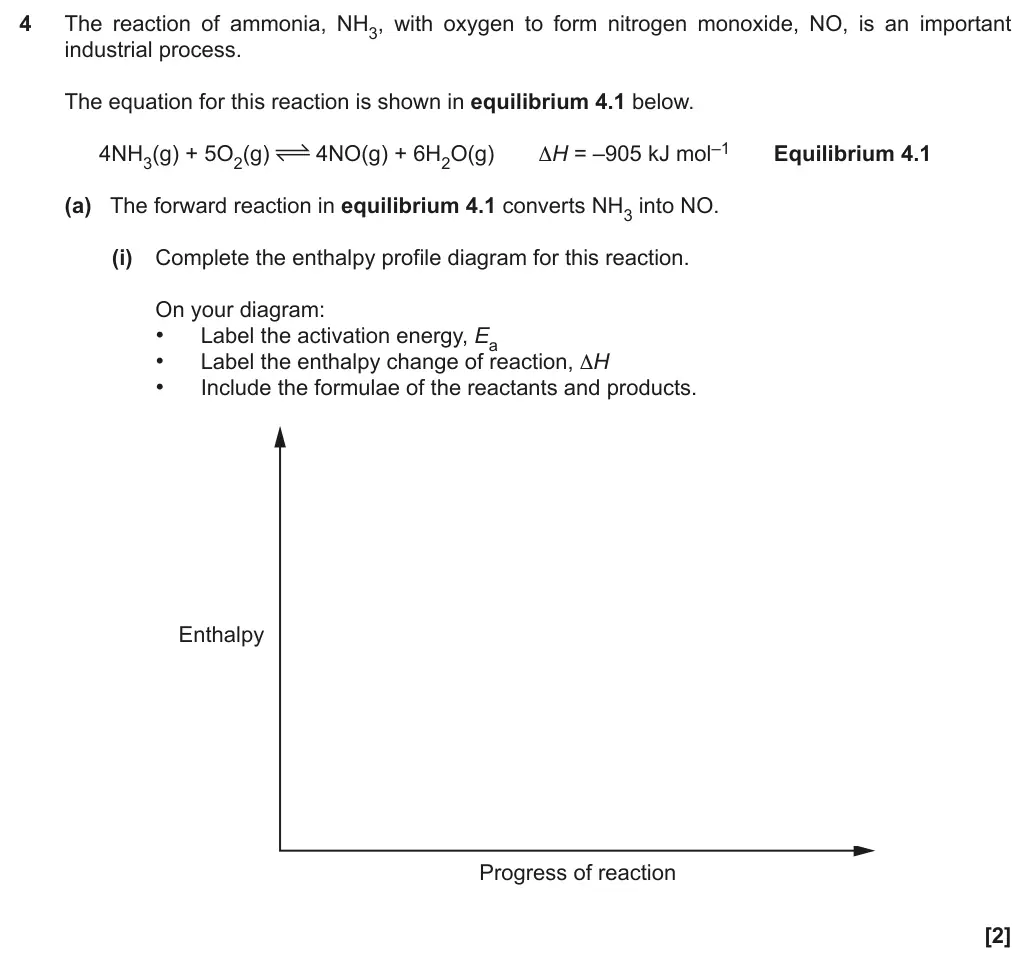
3.2.2(c)(ii) in allowing a reaction to proceed via a different route with lower activation energy, as shown by enthalpy profile diagrams
3.2.2(d)(i) explanation of the terms homogeneous and heterogeneous catalysts
3.2.2(d)(ii) explanation that catalysts have great economic importance and benefits for increased sustainability by lowering temperatures and reducing energy demand from combustion of fossil fuels with resulting reduction in CO2emissions
3.2.2(e) the techniques and procedures used to investigate reaction rates including the measurement of mass, gas volumes and time
3.2.2(f) qualitative explanation of the Boltzmann distribution and its relationship with activation energy (see also 3.2.1 c)
3.2.2(g) explanation, using Boltzmann distributions, of the qualitative effect on the proportion of molecules exceeding the activation energy and hence the reaction rate, for:
3.2.2(g)(i) temperature changes
3.2.2(g)(ii) catalytic behaviour (see also 3.2.2 c).
Six-mark level of response questions on this topic
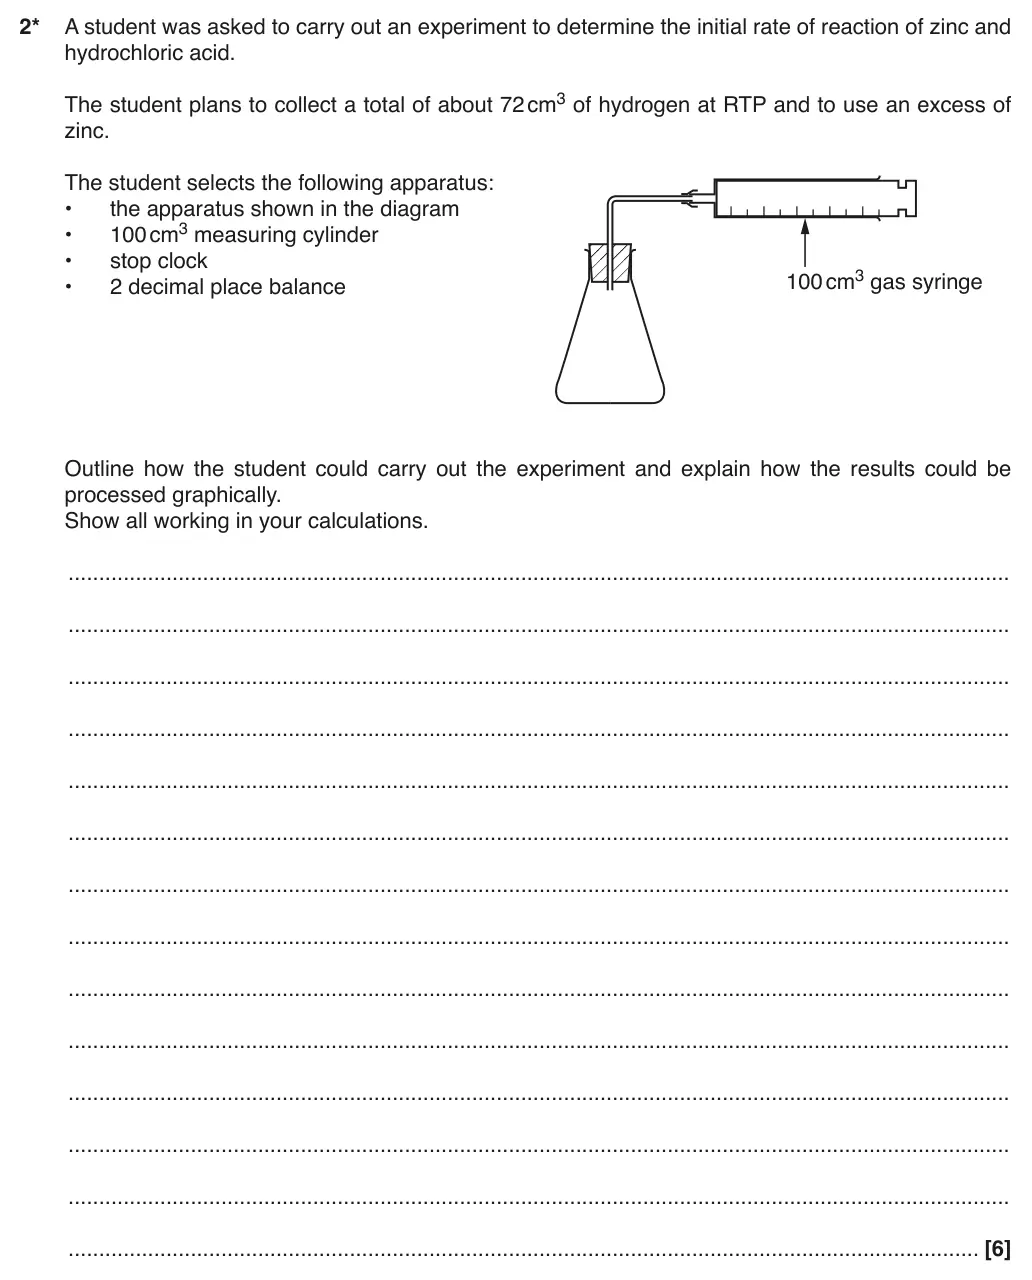
A student was asked to carry out an experiment to determine the initial rate of reaction of zinc and Outline how the student could carry out the experiment and explain how the results could be
Tap a question to zoom it. Where a part needs a table, graph or structure from an earlier part, that part folds out above it; the mark scheme and examiner's comment open underneath. Have the OCR Data Sheet beside you.
June 2025 · Paper 1 · Q51 markMultiple choiceMedium
Answer
B
Mark scheme
Examiner's comment
The correct answer was B. Candidates had to draw the tangent and calculate the gradient at 30 seconds. The answer should then be selected from the closest value to take the inaccuracy of the tangent into consideration. The most common incorrect answer was C, where candidates incorrectly calculated an average rate for the first 30 seconds.
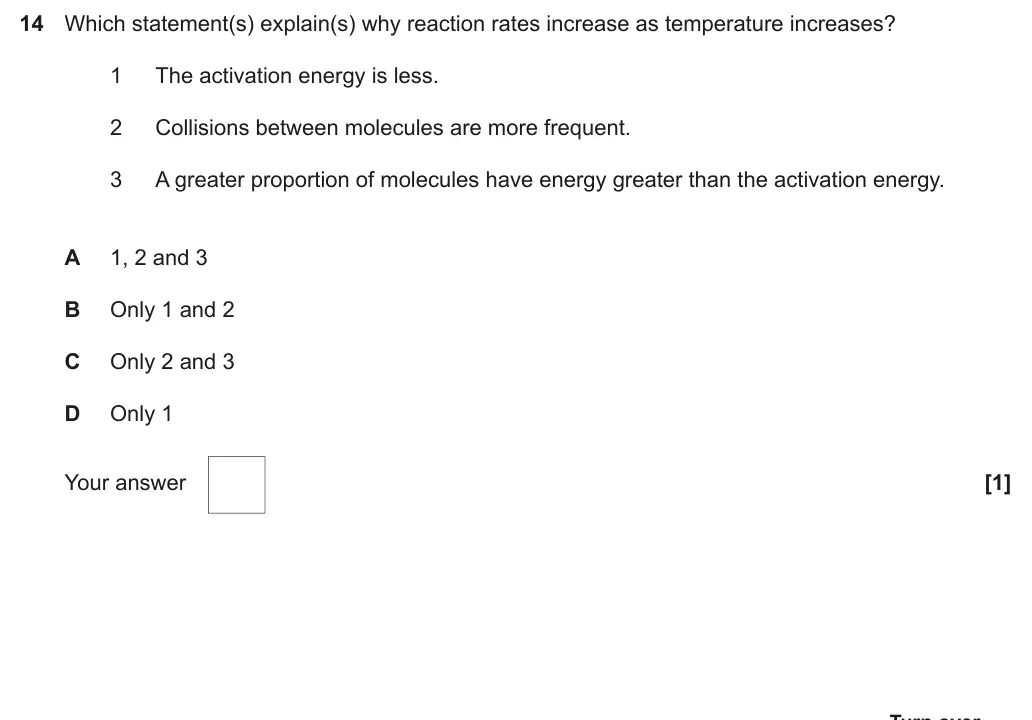
June 2025 · AS Paper 1 · Q121 markMultiple choiceHard
Answer
B
Mark scheme
Examiner's comment
Overall, candidates had little difficulty with this question and most selected B.
June 2025 · AS Paper 1 · Q131 markMultiple choiceMedium
Answer
B
Mark scheme
Examiner's comment
The correct option of B was missed by a quarter of candidates. C was the main distractor, ignoring that a catalyst has no effect on the position of equilibrium.
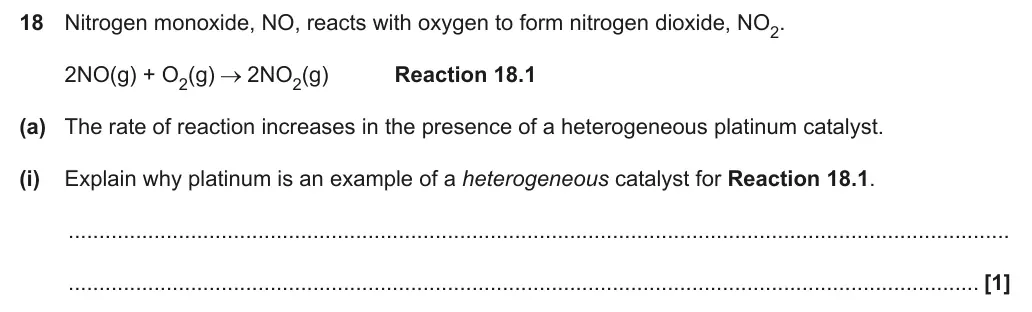
June 2025 · Paper 1 · Q18(a)(i)1 markShort answerMedium
Mark scheme
Examiner's comment
This was a well answered question. A few candidates, incorrectly, suggested that it was heterogeneous due to the reactants and products being in different states, and didn’t mention the catalyst or suggested the catalyst was in same state.
Notes from the mark scheme and report
Pt in a different state/phase from the reactants (solid, reactants gases)
IGNORE products
June 2025 · Paper 1 · Q18(a)(ii)2 marksShort answerHard
Earlier part of question 18 that this part uses
Mark scheme
Examiner's comment
Many candidates gave a good Boltzmann distribution graph, even though a few did not start at the origin, and some were horizontal on the far right-hand side, much above the 0 line. The quality of the Boltzmann distribution could be improved by the candidates, although marks were given. Occasionally candidates drew multiple lines, presumably addressing a change of temperature. This question proved difficult for some candidates to explain well. Collision theory linked to catalyst requires the link between number of particles having energy ≥ the activation energy. A lot of candidates wrote vague responses, often confusing or mixing temperature and concentration effects and did not gain credit. The candidate drew a curve clearly starting at 0,0 but then drew a horizontal line above 0 on the right- hand side. This line would never approach 0 and has a constant number of molecules with the increasing energy and so was not given credit.
Notes from the mark scheme and report
curve starts at/near origin, does not touch x-axis at high energy and is not level
DO NOT ALLOW multiple curves
catalysed Ec marked to the left of Ea (lower activation energy) AND greater proportion of molecules with E ≥ Ea
DO NOT ALLOW 'more frequent collisions' or 'molecules have more energy'
We have produced a delivery guide on rates with some useful resources to help consolidate ideas and avoid misconceptions such as these: Teach Cambridge (ocr.org.uk)
Skills: M3.1 Translate information between graphical, numerical and algebraic forms
June 2025 · Paper 1 · Q18(a)(iii)1 markShort answerMedium
Earlier part of question 18 that this part uses
Mark scheme
Examiner's comment
Most responses were excellent, with many candidates mentioning more than one of the marking criteria. A typical response would be ‘lower temperatures can be used, decreasing use of (fossil) fuels, and reducing CO2 / greenhouse gas emissions.’ Some responses instead mentioned that catalysts can be reused. The most common incorrect response was to say fewer toxic products were released or similar.
Notes from the mark scheme and report
lower temperature/less energy demand so less fossil fuel burnt and less CO2
catalyst can be reused
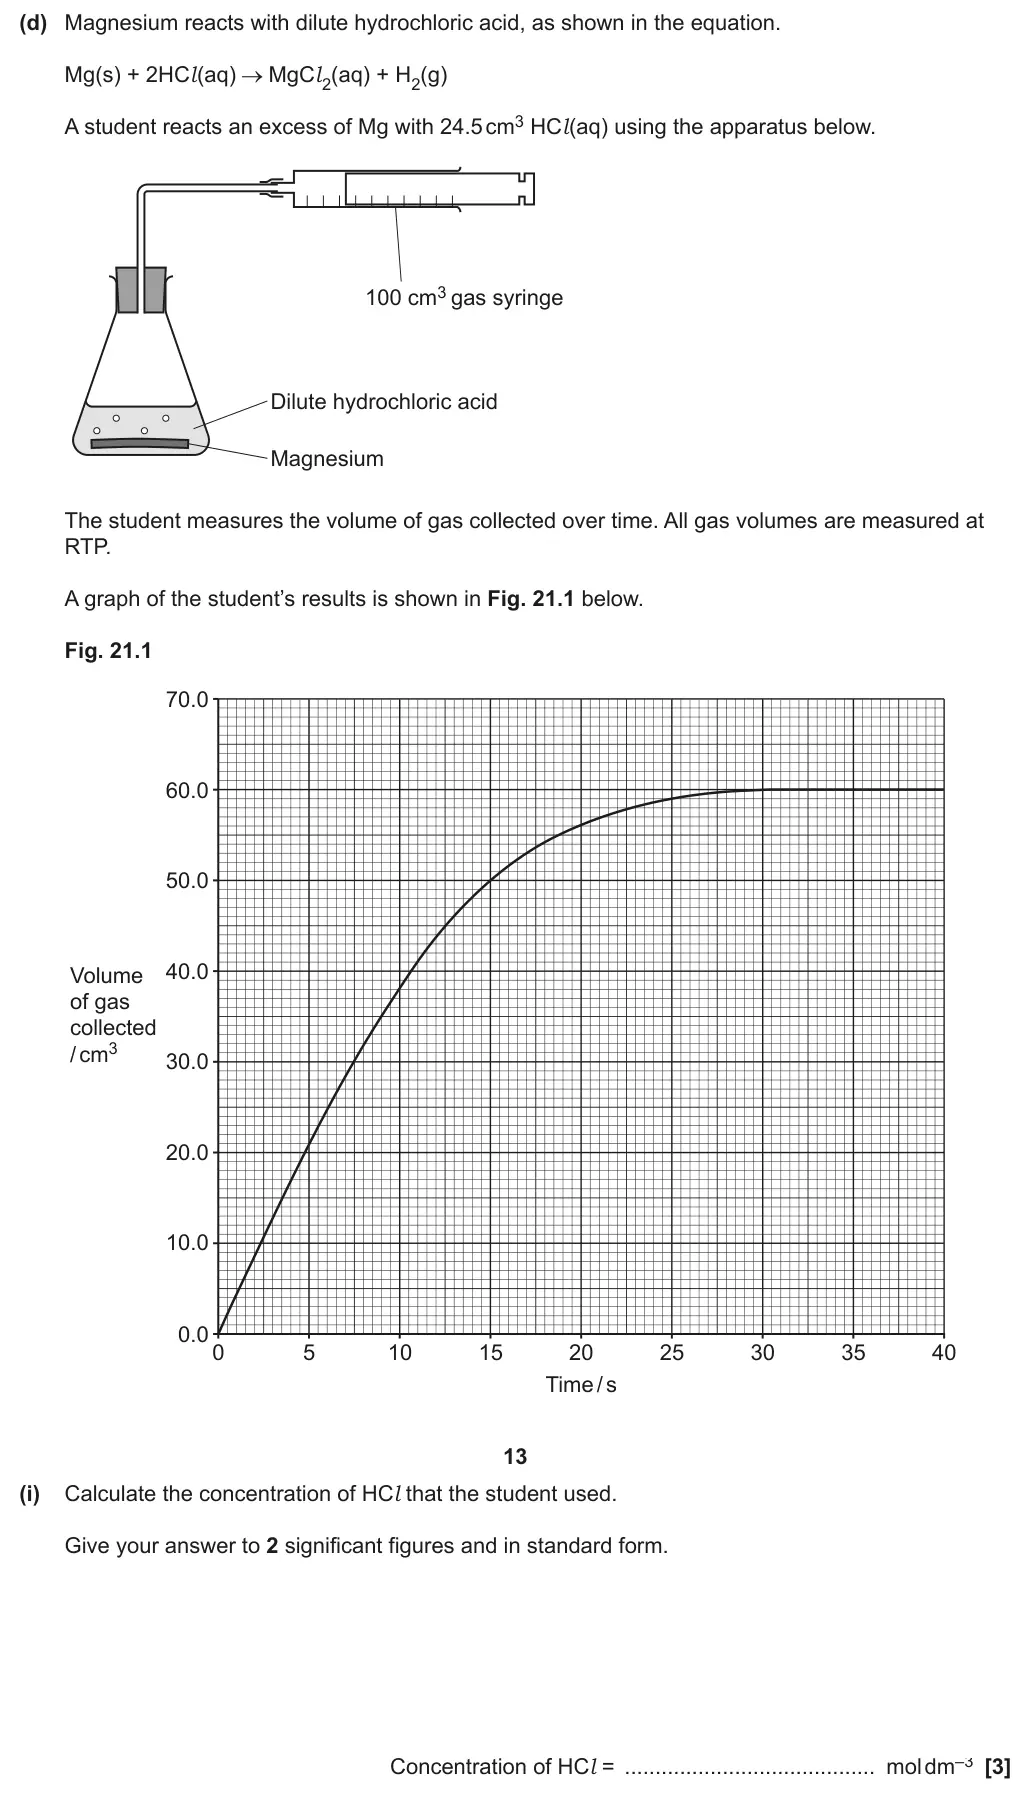
June 2025 · AS Paper 1 · Q21(d)(ii)3 marksData interpretationMedium
Earlier part of question 21 that this part uses
Mark scheme
Examiner's comment
This question required candidates to appreciate that initially concentration of HCl is at its highest, leading to more frequent collisions. As the reaction proceeds, concentration and collision frequency decrease until HCl is used up and the reaction stops (shown by the graph plateauing). The first marking point ignored candidates incorrectly discussing concentration of solid magnesium, but candidates need to be clear that only the (limiting) reactant, HCl, was used up when the reaction stopped for the third marking point. This last point was often missed, and this would be a good question to use with high-attaining candidates. Apart from the last point, there was an even spread of marks given; the second point was often missed through lack of ‘frequency’ or other link to collision rate. Analysing data in graphs Lower scoring candidates often stated that ‘the line increases because rate/concentration increases’. Students should be encouraged to carefully read axes to make sure they are identifying the correct trend from a graph.
Notes from the mark scheme and report
less frequent collisions/fewer per second (IGNORE 'fewer collisions' or 'fewer successful collisions' with no link to time)
acid used up (DO NOT ALLOW magnesium/reactants used up, Mg is in excess)
IGNORE 'magnesium concentration decreases'
DO NOT ALLOW rate increases
Skills: M3.1 Translate information between graphical, numerical and algebraic forms; PAG9 Rates of reaction – continuous monitoring
June 2024 · Paper 1 · Q81 markMultiple choiceMedium
Answer
B
Mark scheme
Examiner's comment
The correct answer was B. Candidates had a good knowledge of the Boltzmann distribution and few incorrect responses were seen.
June 2024 · AS Paper 1 · Q121 markMultiple choiceMedium
Answer
A
Mark scheme
Examiner's comment
Most candidates were aware that heat increases the number of molecules that have energy greater than the activation energy (A).
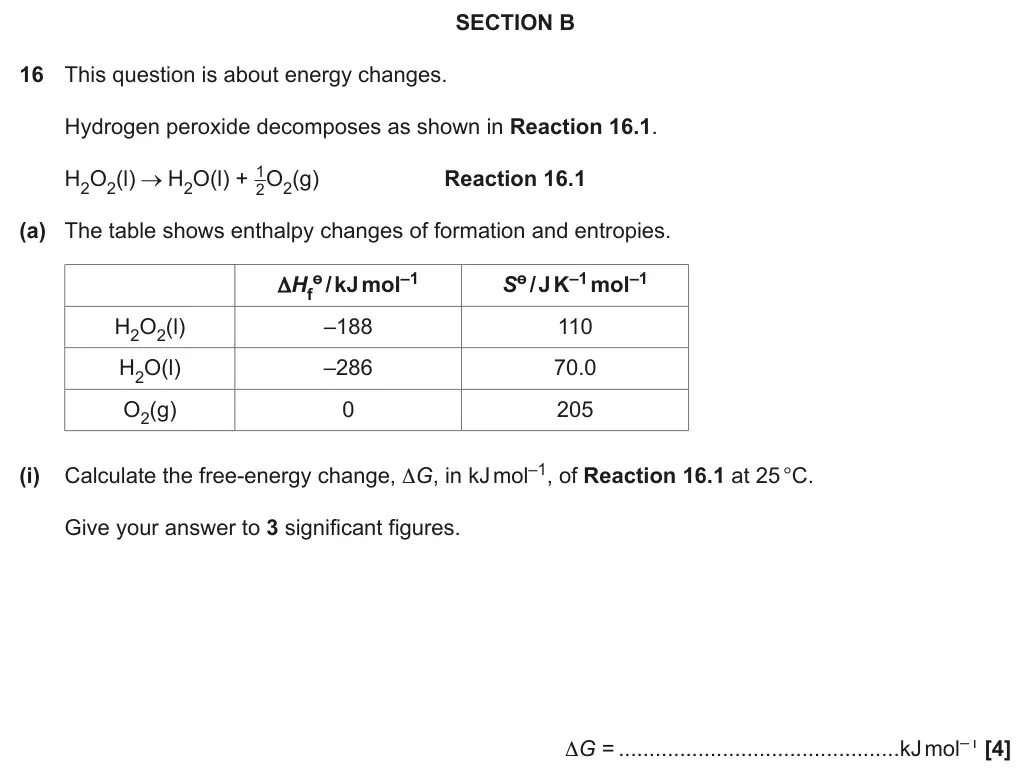
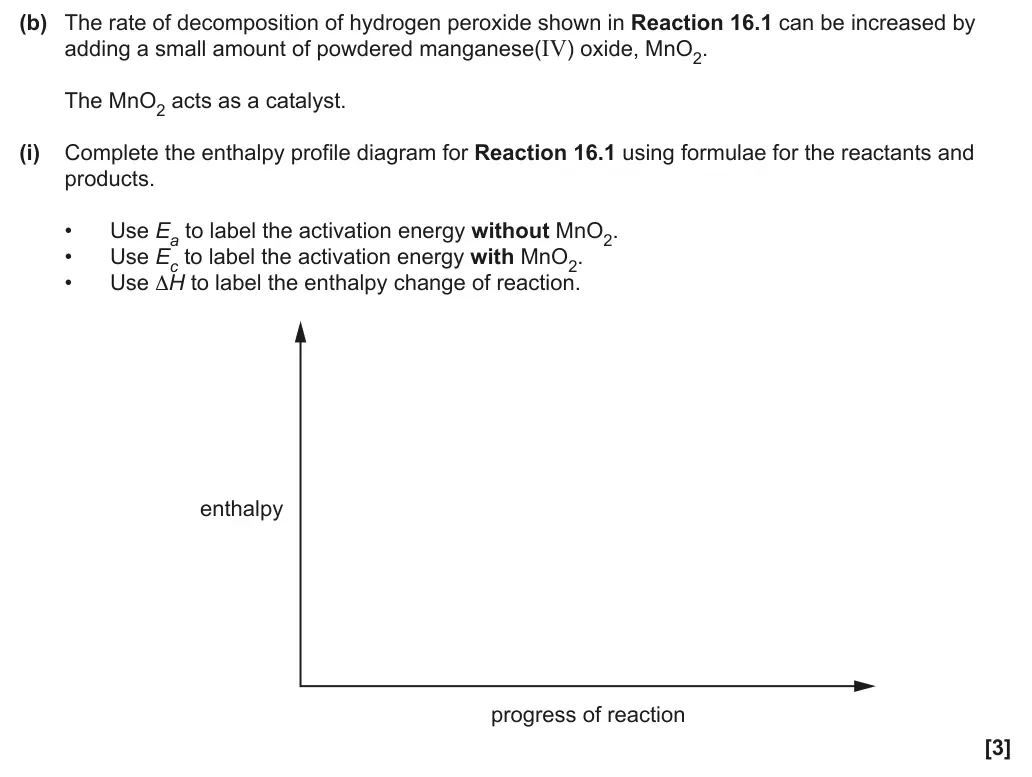
June 2024 · Paper 1 · Q16(b)(i)3 marksComplete table/diagramHard
Earlier part of question 16 that this part uses
Mark scheme
Examiner's comment
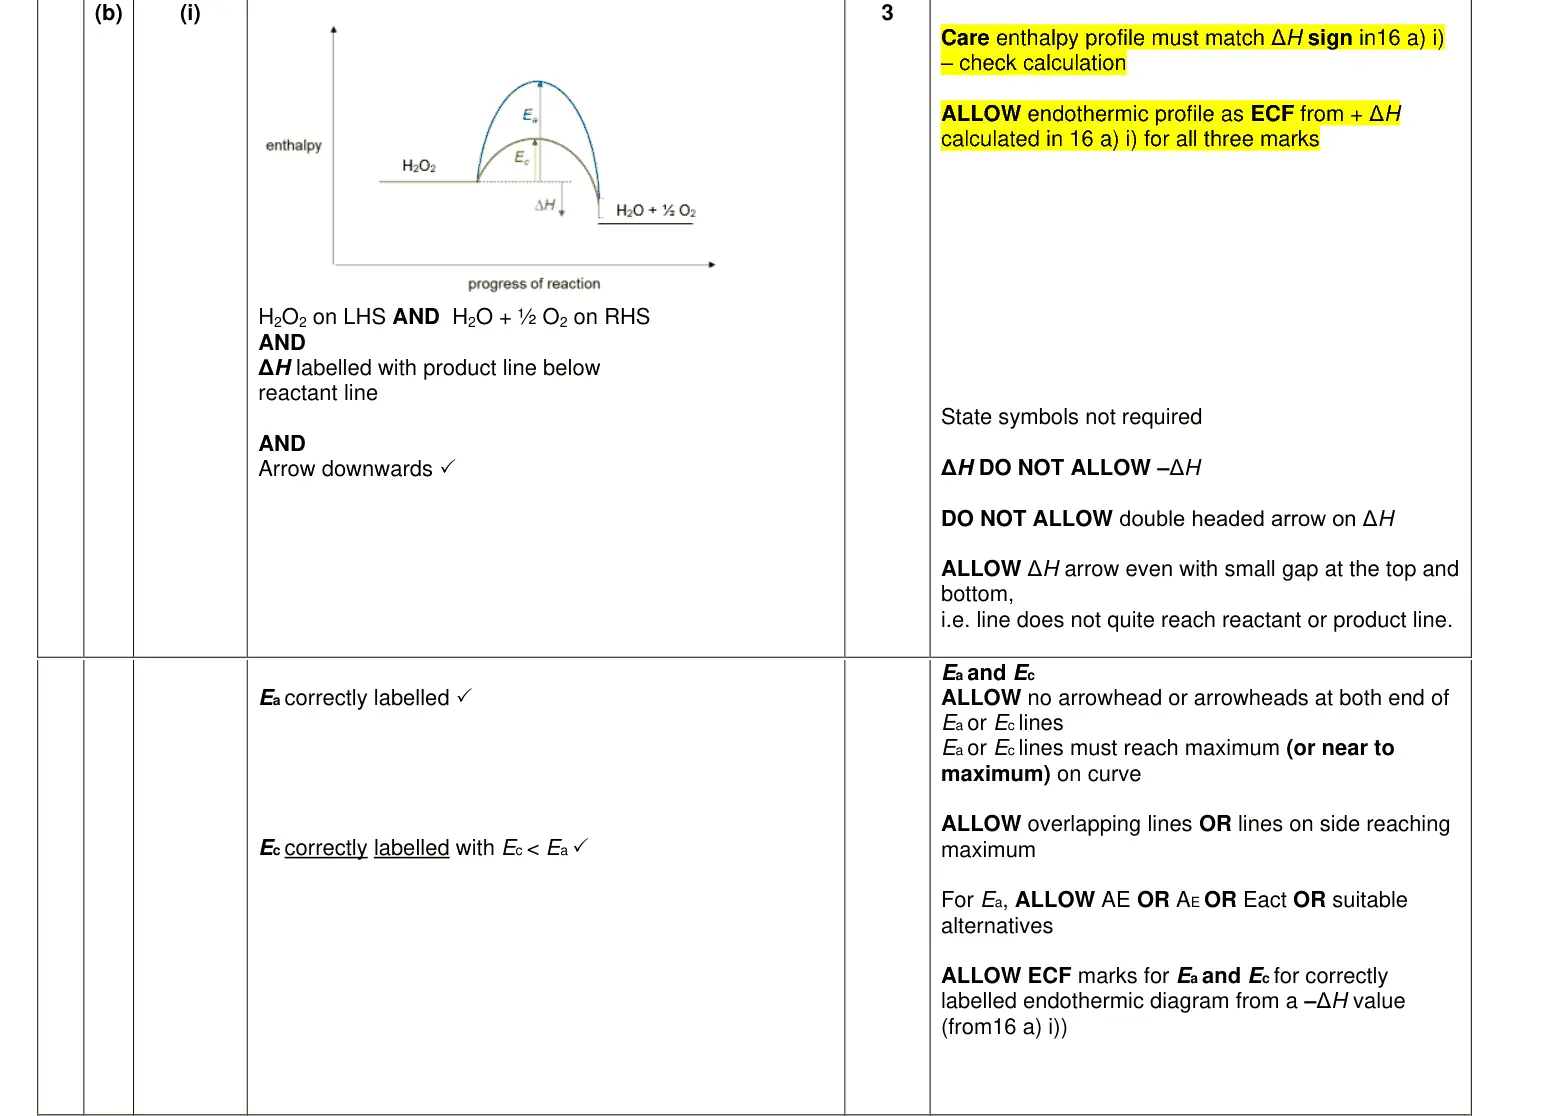
This question proved more difficult for candidates with lots of inaccuracies. The profile was dependent on the calculation for ΔH in Question 16 (a) (i). The arrowhead for ΔH needs to be pointing from the reactants to the products. The activation energies, again, need to start at the reactant line and go to the maximum level of the curve. Those that needed to draw an endothermic profile were far more likely to make an error with the Ea and Ec arrows, often starting from the product line or even from the base line of the graph. A significant number of candidates did not add arrows and instead labelled the curves Ea and Ec. Some candidates drew a Boltzmann distribution curve scoring 0 marks. The candidate has the correct exothermic profile but has the incorrect starting point for the activation energy going from the product line.
Notes from the mark scheme and report
profile must match the sign of ∆H from (a)(i) (ECF allowed)
Ea and Ec lines both start at reactant level
June 2024 · Paper 1 · Q16(b)(ii)1 markShort answerMedium
Mark scheme
Examiner's comment
This was a well answered question. A few candidates, incorrectly, suggested that it was heterogeneous due to the reactants and products being in different states, and did not mention the catalyst.
Notes from the mark scheme and report
state/phase of catalyst compared with reactant
IGNORE references to products
June 2024 · Paper 1 · Q17(a)1 markShort answerHard
Mark scheme
Examiner's comment
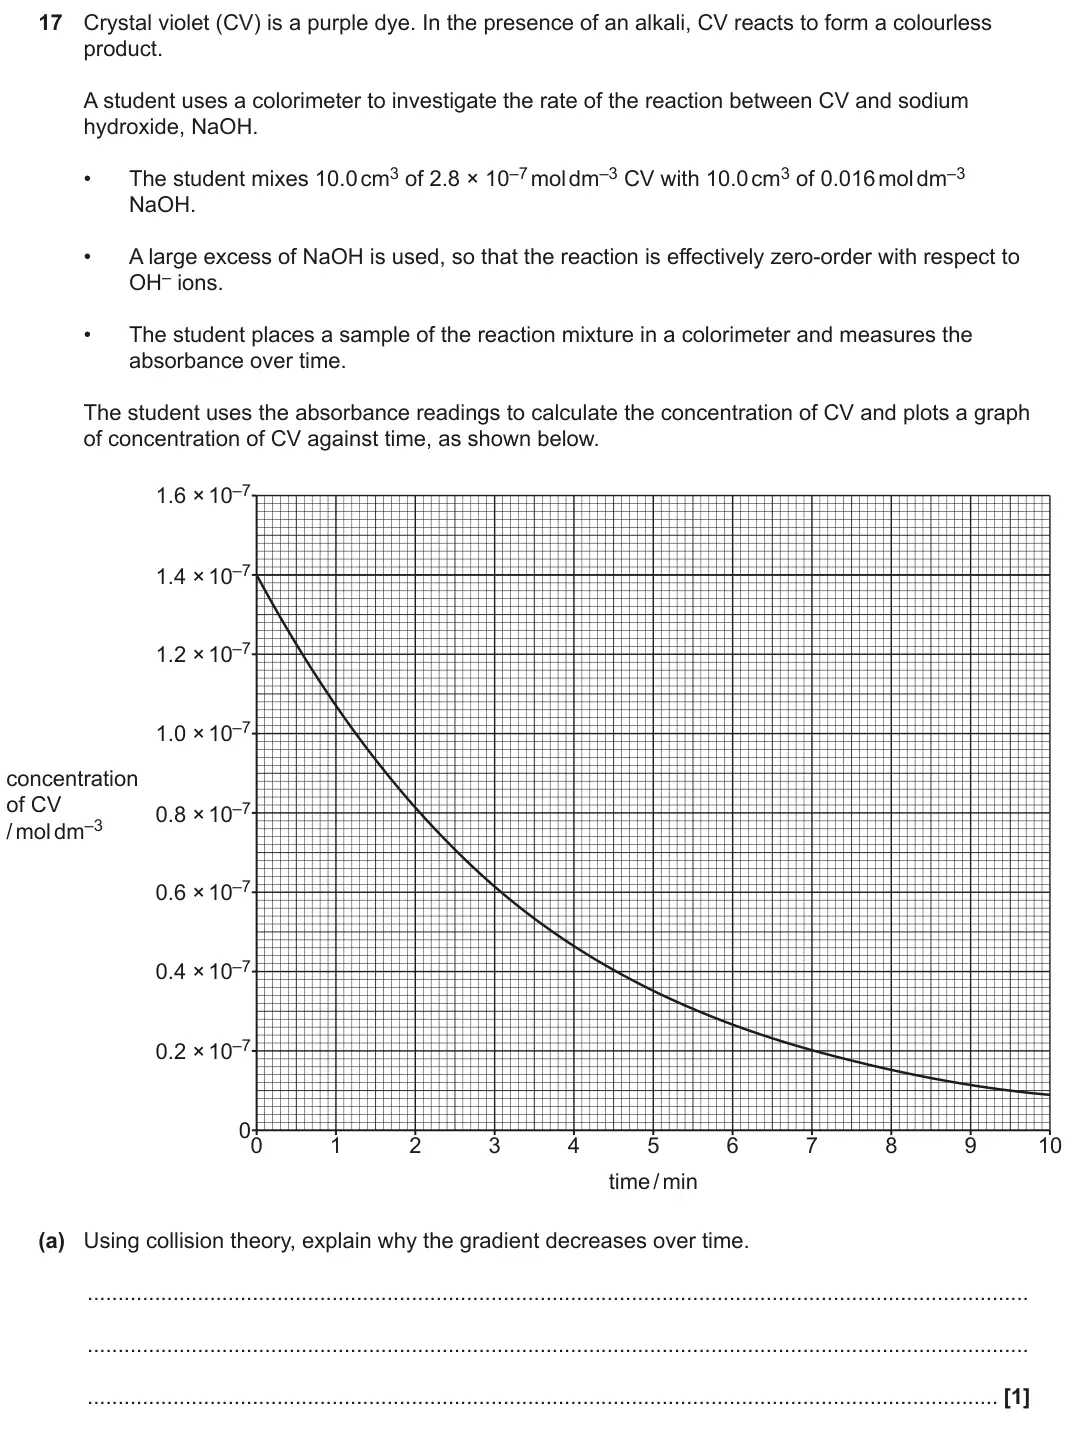
This question proved difficult for candidates to explain well. Collision theory linked to rate requires a quantitative approach, e.g. less particles per unit volume and less collisions per unit time. A lot of candidates wrote vague responses about fewer particles so less collisions and did not gain credit.
Notes from the mark scheme and report
'fewer collisions' needs 'per unit time' / less frequent
IGNORE 'fewer reacting particles'
Some candidates described a decrease in energy in the reaction or gave responses related to activation energy for the concentration effect. For example, ‘reactants have less kinetic energy’ and ‘only a certain number of particles which have enough energy above the activation energy…over time energy will decrease and less particles have enough energy’.
We have produced a delivery guide on rates with some useful resources to help consolidate ideas and avoid misconceptions such as these: Teach Cambridge (ocr.org.uk)
June 2024 · AS Paper 2 · Q4(a)4 marksDrawing / labellingHard
Mark scheme
Examiner's comment
This is a familiar question with around half of candidates scoring all 4 marks. Common errors included drawing 2 lines, as you would have with different temperatures, but labelling one with catalyst and other without. Some had incorrect or missing labels on the axes. The most frequently gained mark was for knowing that the activation energy was lowered by a catalyst; this could be given by correct lines and labelling shown on the distribution, although care needed to be taken as some contradicted their answers with their diagram. Some labelled Ea and Ec lines but didn’t have energy on x-axis scale. Some struggled with the final marking point, not recognising that more molecules have the required activation energy. For example, ‘more frequent successful collisions’ with no reference to the activation energy, i.e. why they are successful.
Notes from the mark scheme and report
one curve only, starting at origin and not touching x-axis (DO NOT ALLOW two curves – confusion with temperature)
axes: number of molecules vs energy (DO NOT ALLOW atoms/enthalpy)
Ec below Ea
more molecules with energy above activation energy
IGNORE 'more collisions'
Skills: M3.1 Translate information between graphical, numerical and algebraic forms
June 2024 · AS Paper 2 · Q4(b)(ii)2 marksCalculationMedium
Earlier part of question 4 that this part uses
Mark scheme
Examiner's comment
More candidates were able to correctly draw a tangent than seen in previous years with similar questions. A generous range was given for both tangent and gradient so many scored both marks. The most common reasons for losing marks was for having a gap between the curve and the tangent or calculating the gradient incorrectly, e.g. misreading scales, dx/dy, or by using interpolation rather than a tangent.
Notes from the mark scheme and report
tangent at 50 s (±10 s)
rate = gradient about 0.67 cm3 s–1
DO NOT ALLOW interpolation
ALLOW ECF from tangent or straight line of best fit
Skills: M3.5 Draw and use the slope of a tangent to a curve as a measure of rate of change; PAG9 Rates of reaction – continuous monitoring
June 2023 · AS Paper 1 · Q131 markAO1Multiple choiceMedium
Answer
A
Mark scheme
Examiner's comment
The behaviour of the Boltzmann distribution under different conditions is well known with most candidates making the correct choice of A.
June 2023 · AS Paper 1 · Q141 markAO2Multiple choiceHard
Answer
B
Mark scheme
Examiner's comment
This question discriminated well, rewarding those candidates with a good understanding of the link between concentration, time and rate. Many candidates drew a tangent to the curve at 200 s, measuring its gradient to get the correct choice of B. Common errors focused on reading of the concentration at 200 s. This was then either matched to option D directly or divided by 200 to give option A.
June 2023 · Paper 1 · Q20(d)(ii)3 marksAO1, 3Short answerHard
Earlier part of question 20 that this part uses
Mark scheme
Examiner's comment
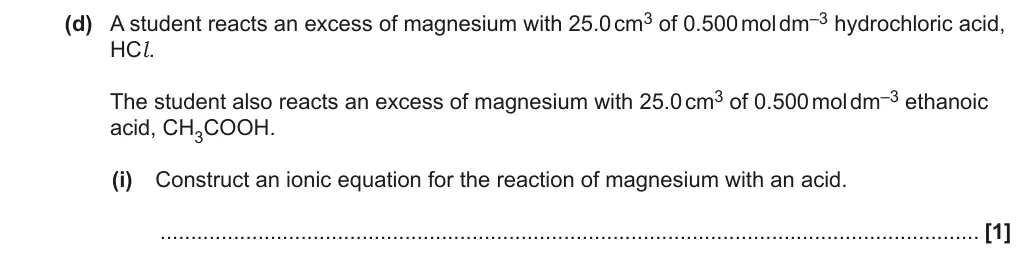
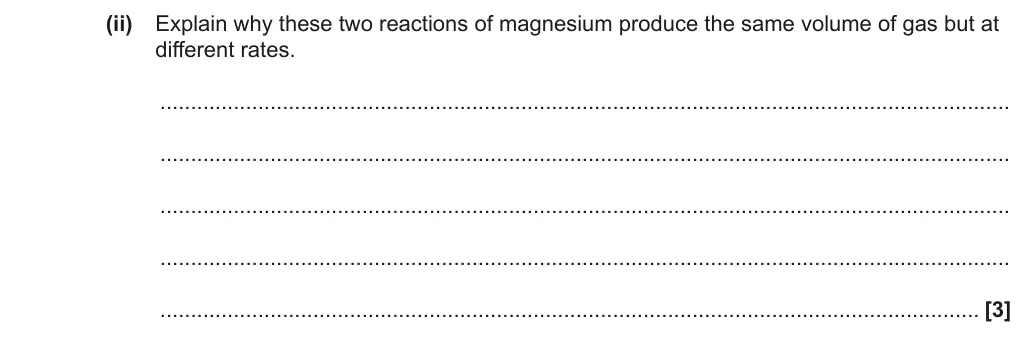
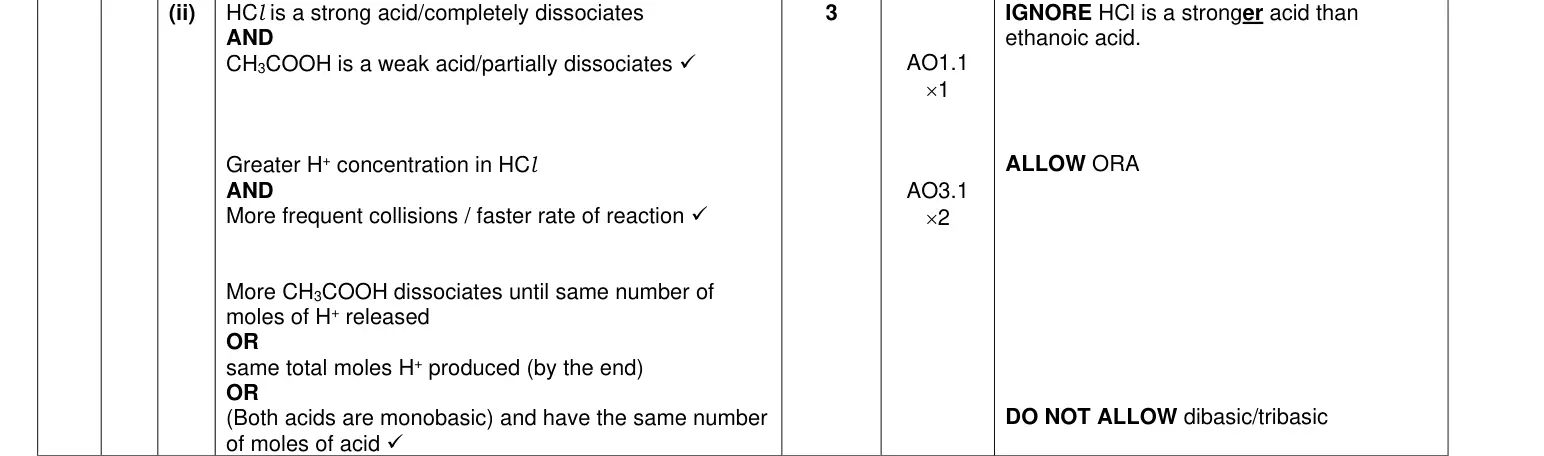
This question proved challenging for the candidates to identify the three ideas: Those of comparing acids, comparing moles and comparing rates. Very few candidates were able to score the 3 marks. Most candidates recognised the different strength of the two acids, but some only used comparative language. Some linked the moles of acid used to the volume of gas produced but many simply restated the same volume and concentration which is given within the question. Only a few candidates linked the higher initial [H+] in HCl to the increased rate through more frequent collisions. A common issue was describing the rate of dissociation rather than the [H+] present in determining the rate of the reactions or mentioning that it dissociates more but not linking this to the H+ concentration.
Notes from the mark scheme and report
HCl completely dissociates AND CH3COOH partially
greater [H+] in HCl so more frequent collisions
same total moles of H+ released as CH3COOH continues to dissociate
IGNORE 'HCl is a stronger acid'
June 2023 · AS Paper 1 · Q23(a)(iii)2 marksAO1Data interpretationEasy
Earlier part of question 23 that this part uses
Mark scheme
Examiner's comment
Almost all candidates knew that a catalyst lowered activation energy and most were aware that an alternative pathway was made possible by a catalyst.
Notes from the mark scheme and report
lowers activation energy AND alternative route/more molecules exceed Ea
IGNORE 'shorter route'
IGNORE more successful collisions
June 2022 · Paper 1 · Q16(a)(i)3 marksAO1Drawing / labellingEasy
Mark scheme
Examiner's comment
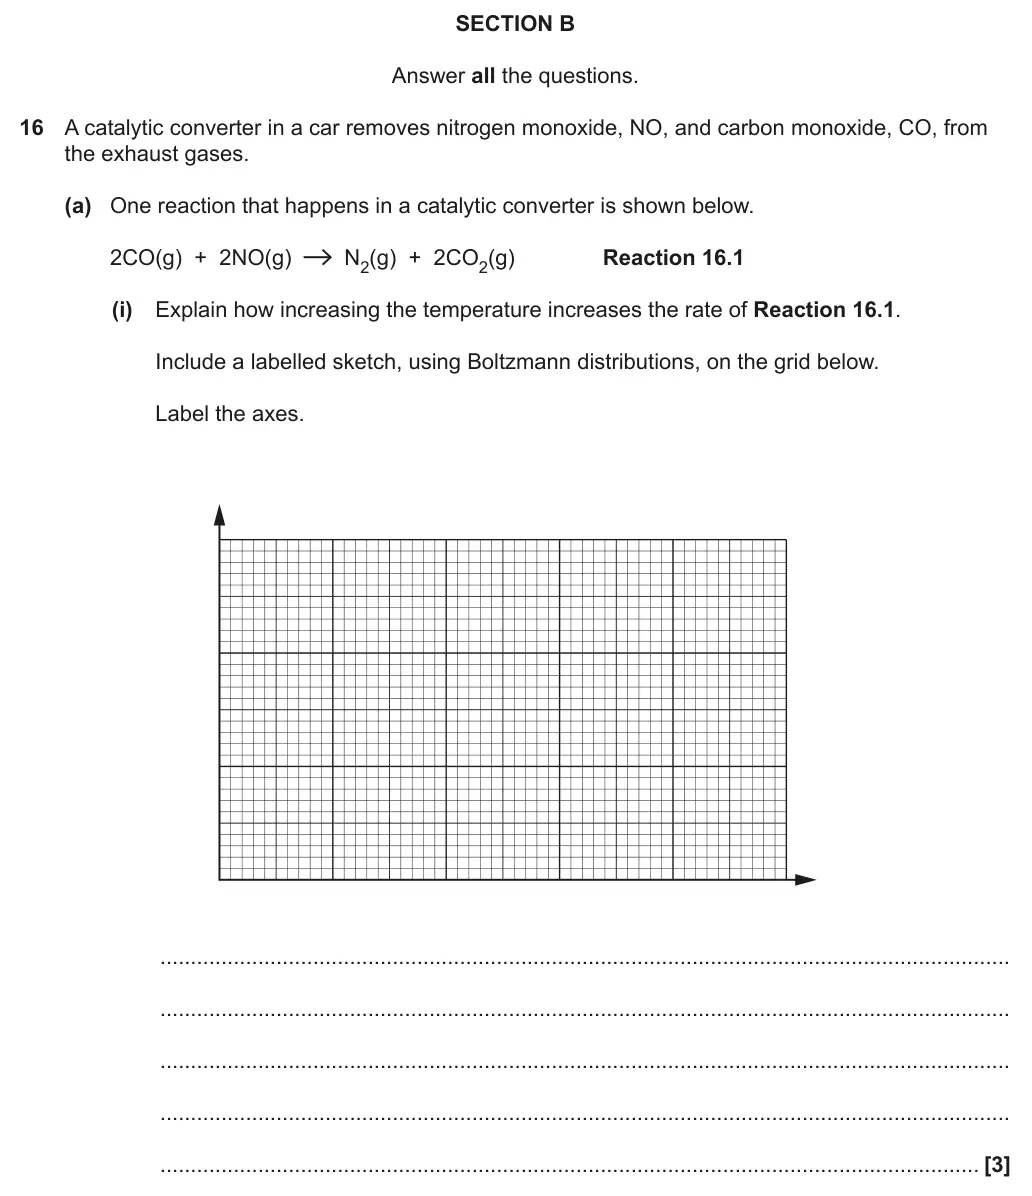
Almost all candidates produced a graph which showed the correct shape curve, although they sometimes incorrectly identified the quantities on the axes, e.g. rate versus time. Those who produced an incorrect diagram were able to discuss ‘more’ particles reaching the activation energy threshold. A few limited their answer to discussing successful collisions. Candidates needed to identify which curve was the higher temperature and to make sure that the curves did intersect more than once.
Notes from the mark scheme and report
axes: number of molecules vs energy (DO NOT ALLOW atoms/enthalpy)
curve from origin, not touching x-axis
higher-T curve has lower peak shifted right, crossing once
more molecules with energy above Ea
DO NOT ALLOW 'lowers Ea'
IGNORE more successful collisions
Skills: M3.1 Translate information between graphical, numerical and algebraic forms
June 2022 · AS Paper 1 · Q25(b)3 marksAO1Drawing / labellingMedium
Mark scheme
Examiner's comment
Most candidates answered this question well. Most graphs were drawn with care but some peaks were shown at the same height as the provided curve or meeting this curve at high energy. Some candidates labelled what should have been ‘energy’ on the x axis as ‘progress of reaction’, or used ‘atoms’ rather than molecules for the y axis label. Many candidates were able to explain that more molecules exceed the activation energy at a higher temperature.
Notes from the mark scheme and report
new curve starts at origin, peak lower and to the right, finishes above the original and does not touch the x axis
axes: number of molecules and energy (IGNORE enthalpy, IGNORE atoms)
IGNORE 'more successful collisions/collide more frequently'
DO NOT ALLOW two activation energies
Skills: M3.1 Translate information between graphical, numerical and algebraic forms
June 2022 · AS Paper 2 · Q3(a)(i)3 marksAO1, 2Data interpretationHard
Mark scheme
Examiner's comment
Only a small number of candidates managed to score all 3 marks for this question. Lots began their response describing why the rate is high at the start. This often filled the space available with marks being gained only in the last sentence. Very few gave descriptions with this specific reaction in mind, such as recognising that the HCl was the limiting reagent so gets used up, leaving some MgCO3 remaining. Common errors included referring to “fewer collisions” but without any indication of time, or “less reactant” without considering the volume of the reaction. We have produced a delivery guide on rates with some useful resources to help consolidate ideas and avoid misconceptions such as these: https://www.ocr.org.uk/Images/231742-rates-delivery-guide.pdf
Notes from the mark scheme and report
acid CONCENTRATION decreases (IGNORE amount)
fewer collisions per second/less frequent ('fewer collisions' alone not linked to rate)
stops when acid/limiting reagent used up
Many candidates described a decrease in energy in the reaction or gave responses related to activation energy. For example: “lose energy and start to collide less often”, “reactants have less kinetic energy” and “only a certain number of particles which have enough energy above the activation energy…over time energy will decrease and less particles have enough energy”.
Skills: M3.1 Translate information between graphical, numerical and algebraic forms
June 2022 · AS Paper 2 · Q3(a)(ii)2 marksAO3CalculationMedium
Earlier part of question 3 that this part uses
Mark scheme
Examiner's comment
Most candidates recognised that they needed to draw a tangent. Candidates need to be instructed to draw their line clearly and make sure that it covers several large squares on the graph – preferably extending to the axes. The range given for the calculated rate from the gradient of the tangent was generous, however some did not realise that the y-axis started at 91.0 so incorrectly calculated their gradient. Some candidates used interpolation so gained no marks.
Notes from the mark scheme and report
tangent drawn at t = 50 s (±10 s)
DO NOT ALLOW interpolation/direct reading - must be a gradient
range 5.7 × 10^-3 to 6.9 × 10^-3
IGNORE units and sign
ALLOW ECF from incorrect tangent
M3 section of the Maths Skills handbook contains useful information on use of graphs in chemistry, including M3.5 on drawing and using the slope of the tangent to a curve as a measure of a rate of change: https://www.ocr.org.uk/Images/295468-chemistry-mathematical- skills-handbook.pdf
Skills: M3.1 Translate information between graphical, numerical and algebraic forms; M3.5 Draw and use the slope of a tangent to a curve as a measure of rate of change; PAG9 Rates of reaction – continuous monitoring
June 2022 · AS Paper 2 · Q3(a)(iii)2 marksAO3Data interpretationHard
Earlier part of question 3 that this part uses
Mark scheme
Examiner's comment
About a third of candidates didn’t score any marks here. Some did not follow the instructions to add their curve to the previous graph. The sketches produced in the blank space then usually lacked any scales on the axes so could not be given marks. Lines added were often inaccurately drawn with lines often extending below 91.55g before returning to this mass at the end. It was often difficult to interpret if a graph levelled off before the original with lots tracking the same curve with a very slightly steeper slope. Some gave a slower rate but did manage to gain marks for finishing at 91.55g.
Notes from the mark scheme and report
steeper slope AND levels off earlier
same loss in mass - levels off at about 91.55 g
Skills: M3.1 Translate information between graphical, numerical and algebraic forms; PAG9 Rates of reaction – continuous monitoring
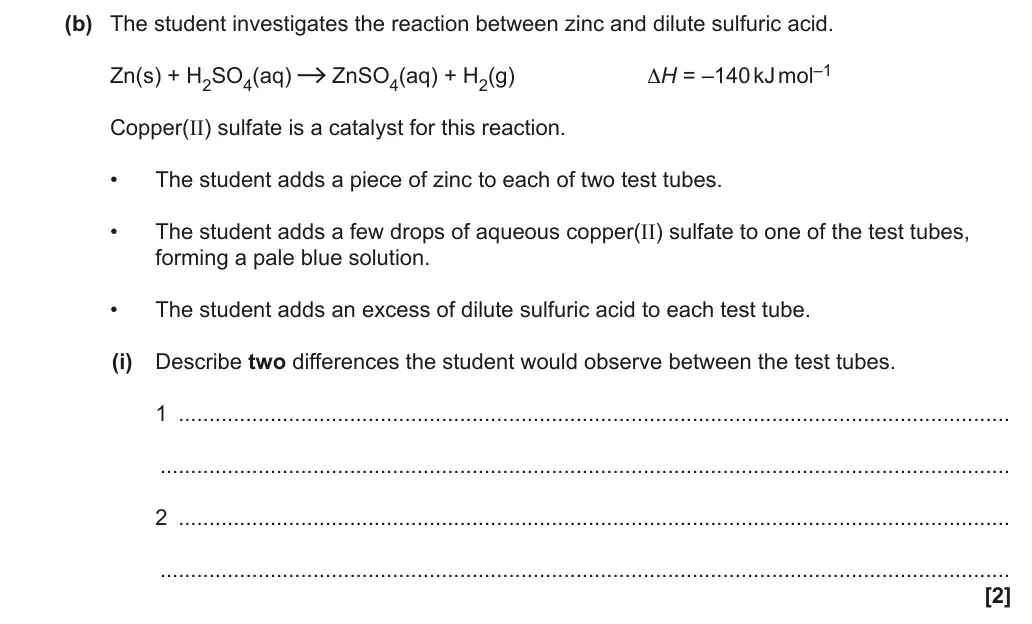
June 2022 · AS Paper 2 · Q3(b)(i)2 marksAO2Short answerHard
Mark scheme
Examiner's comment
Candidates found this question very challenging. Most recognised that the addition of the catalyst would speed up the reaction but could not translate this into observations for this specific practical. For example, “reacts faster”, “releases more hydrogen” or “stops reacting quicker”. Giving candidates the opportunity to observe a range of both familiar and unfamiliar reactions, noting qualitative observations can help to improve their skills here. Many just noted that one tube would be blue and the other colourless rather than considering the reaction taking place. Some indicated that only 1 tube would react and the other would not. A few candidates recognised that a competing displacement reaction would take place between Zn and CuSO4 so were given marks for this.
Notes from the mark scheme and report
more vigorous bubbling
zinc dissolves more quickly
one alternative mark for Cu displacement (red/brown solid or blue solution turns colourless)
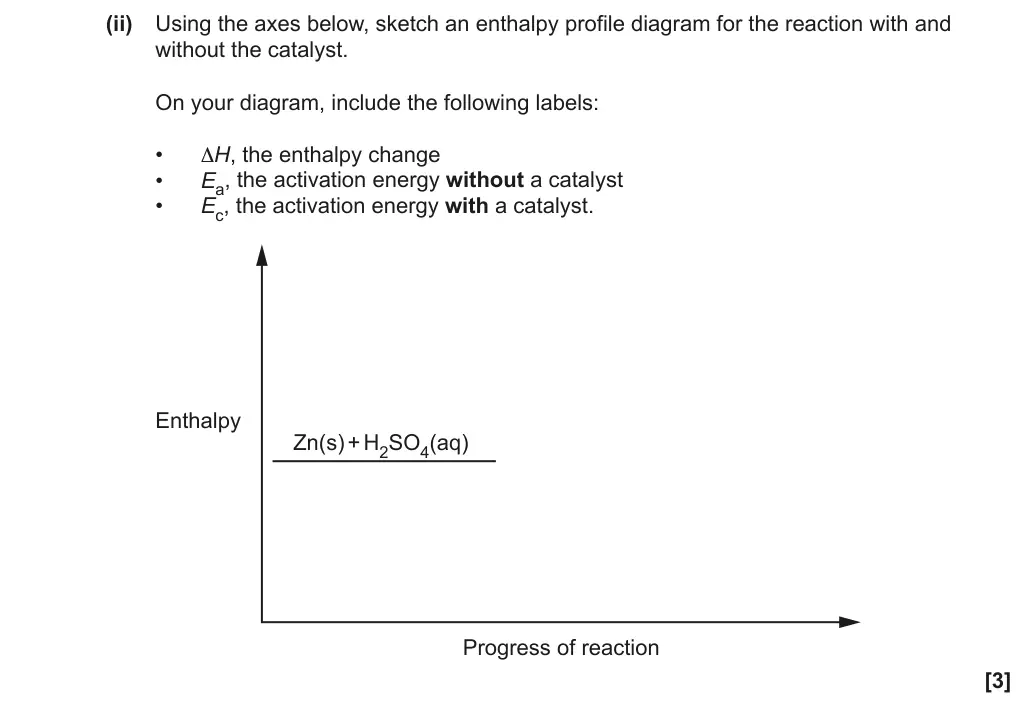
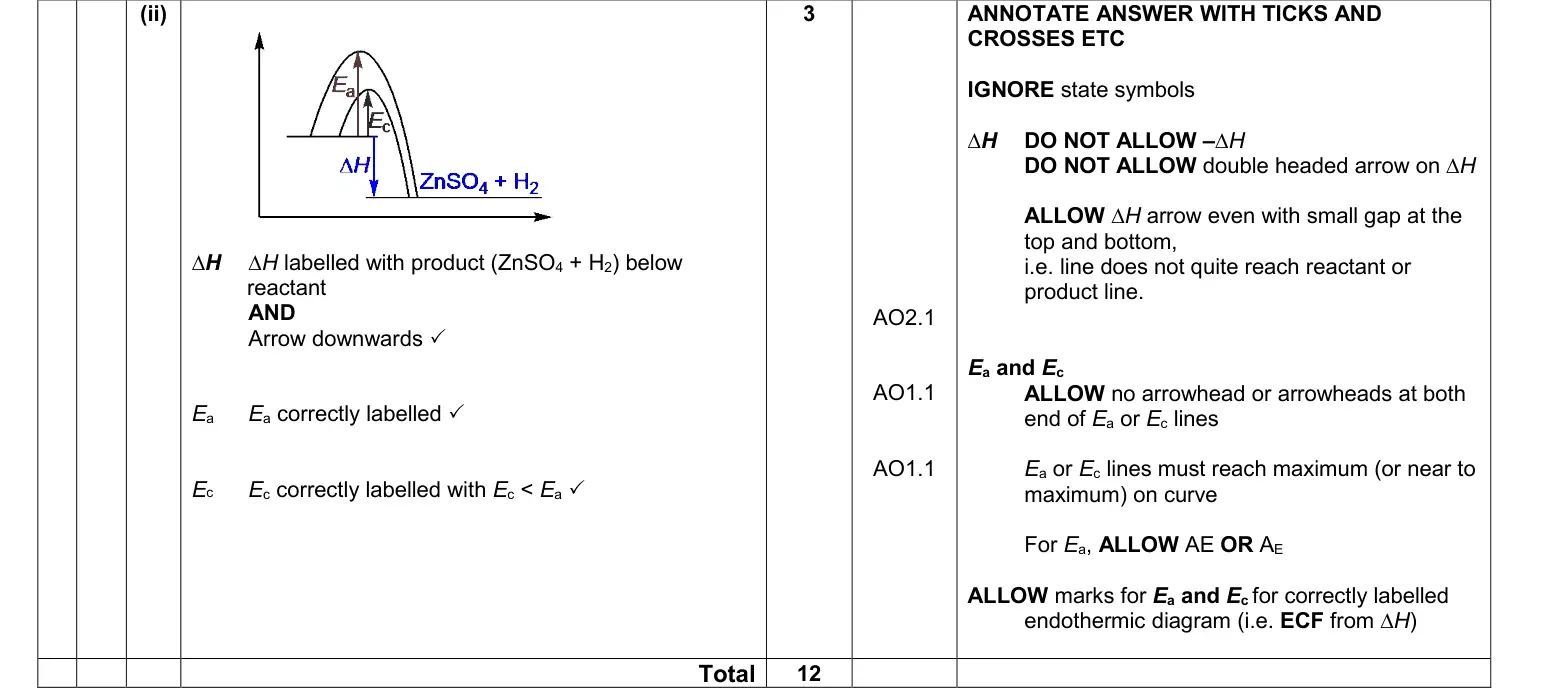
June 2022 · AS Paper 2 · Q3(b)(ii)3 marksAO1, 2Short answerMedium
Earlier part of question 3 that this part uses
Mark scheme
Examiner's comment
Less than half of all candidates managed to gain all 3 marks giving the correct enthalpy profile diagram. Many demonstrated a lack of understanding about what an enthalpy profile diagram shows as seen by labelling of curves for Ea/Ec rather than the enthalpy change or arrows for ∆H extending to the x-axis. Other errors also seen included, -ΔH, double headed ΔH arrow, activation energy lines starting at products, endothermic profiles, Ea and Ec the wrong way round and missing or incorrect labels. Some candidates found it tricky to give activation lines for both catalysed and uncatalysed reactions on the same diagram, these often overlapped or did not extend to the top of the energy barrier.
Notes from the mark scheme and report
products below reactants with ∆H arrow downwards (DO NOT ALLOW –∆H or double-headed arrow)
Ea and Ec arrows from reactant level to top of curve, Ec < Ea
ECF for Ea/Ec on endothermic diagram
Skills: M3.1 Translate information between graphical, numerical and algebraic forms
June 2022 · AS Paper 2 · Q4(a)(i)6 marksAO1, 26-mark level of responseHard
Mark scheme, with the levels and indicative points
Examiner's comment
Only a small number of candidates were given all 6 marks for their response. Many responses made little or no reference to equilibrium, considering only the rate of reaction. A clear understanding of the difference between rate and equilibrium was essential to scoring highly on this question. Excellent descriptions were given regarding the role of the catalyst on the rate of reaction, possibly influenced by the previous question. Some gave detailed responses in terms of the impact of both pressure and temperature on the equilibrium position but then did not give the changes made by industry such as reducing temperature due to energy demand or increasing pressure to increase rate. Some candidates indicated that 15atm was a low pressure including reference to it being “lower than normal atmospheric pressure” which suggested that they did not understand either the measurement in atmospheres and/or scale of pressure. A common incorrect response was to suggest that a higher pressure gives increased yield as more moles on right/products. Some stated that the reaction was exothermic, clearly confusing the enthalpy change signs. Some also described the “endothermic side” demonstrating a lack of understanding that enthalpy changes require a difference between products and reactants. Many did not correctly consider the use of excess of steam to increase concentration of reactant and shift equilibrium to products/right but talked in terms of limiting reagents, e.g. “This is used so all of the methane is reacted” or increased collisions. Many were prone generalisations, e.g. “These conditions are used industrially to achieve the most hydrogen efficiently with the least amount of undesired (waste) products”. Candidates need to be encouraged to plan their answers, even using subheadings to organise information and follow the key approach: point, evidence, explain. Candidates should also be encouraged to re-read their answers to check communication is clear and accurate without any contradictory statements. Many included irrelevant or inaccurate information such as describing the toxicity of carbon monoxide, so reducing yield of that being beneficial, or “using a catalyst improves atom economy”. This exemplar shows a candidate who achieved L3 with all 6 marks given. They have considered both the effect of temperature and pressure on equilibrium and potential compromises used industrially. They have also considered the impact of using a catalyst. Their response is logically structured and has a clear line of reasoning.
Notes from the mark scheme and report
endothermic so high temperature shifts right
2 mol gas to 4 mol so low pressure favours products but reduces rate
compromise pressure
high temperature costs energy
catalyst increases rate without changing equilibrium position
excess steam shifts right
This question was good at highlighting candidates understanding of the impact of different conditions on equilibrium reactions. We have produced a delivery guide to help with teaching about equilibrium: https://www.ocr.org.uk/Images/261544-equilibrium.pdf
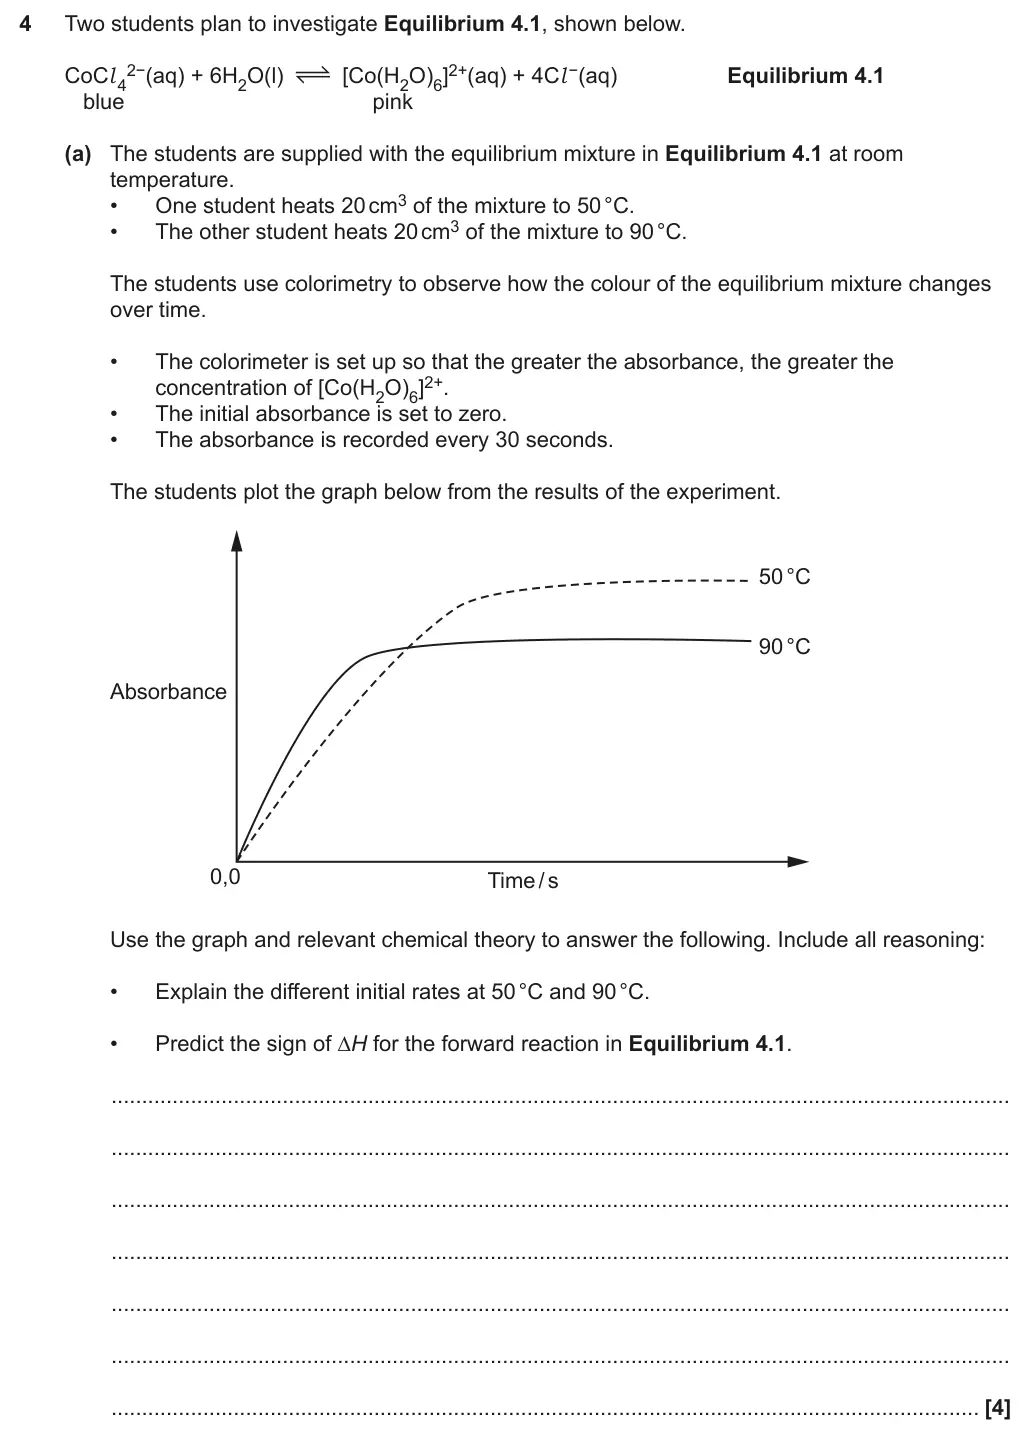
June 2022 · Paper 3 · Q4(a)4 marksAO1, 2Short answerMedium
Mark scheme
Examiner's comment
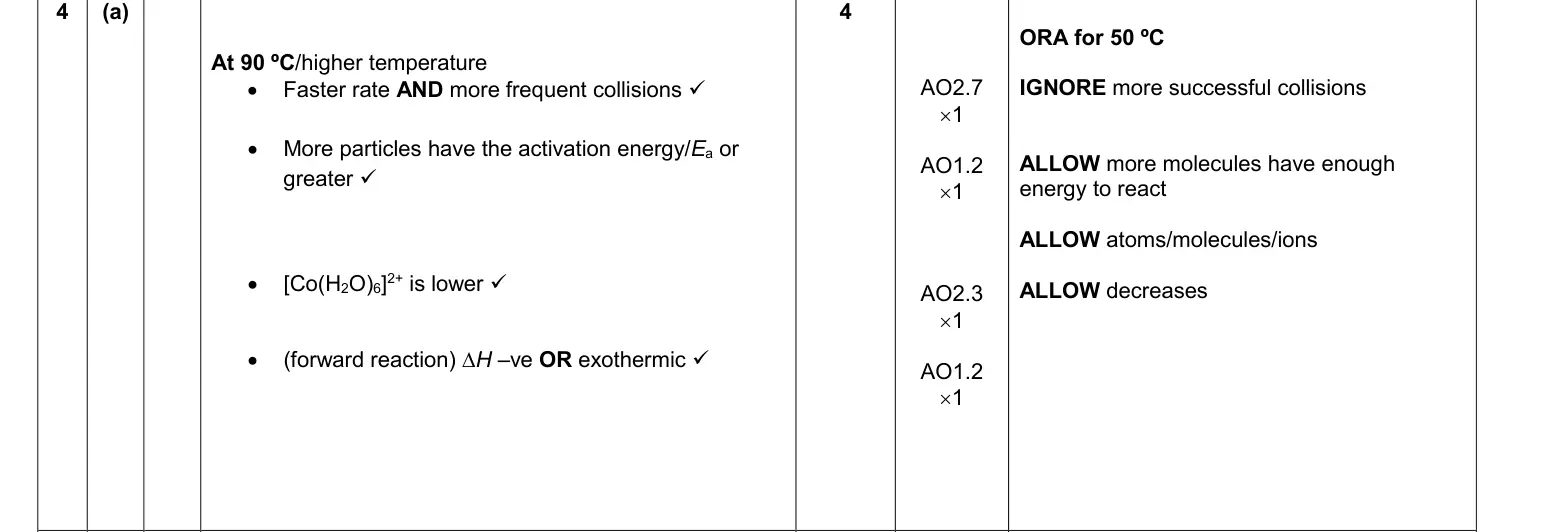
This question asked candidates to explain the different rates from a novel experiment carried out at 50ºC and 90ºC, and to predict the ∆H sign for the forward reaction. Candidate explanations for the rates were often superficial, solely in terms of greater energy at 90ºC. Many responses referred neither to the different frequency of collisions nor the greater number of particles exceeding the activation energy at 90ºC. Most candidates predicted that ∆H would have a negative sign. Candidates were expected to link the evidence from the absorbance data in the graph to less [Co(H2O)6]2+ being present at 90ºC. When experimental information has been presented, candidates are advised to look for the evidence responsible in their explanations.
Notes from the mark scheme and report
at 90 °C faster rate AND more frequent collisions
more particles have energy ≥ Ea
equilibrium [Co(H2O)6]2+ is lower at 90 °C so forward reaction exothermic/∆H negative
IGNORE more successful collisions
Skills: M3.1 Translate information between graphical, numerical and algebraic forms; PAG9 Rates of reaction – continuous monitoring
November 2021 · AS Paper 1 · Q111 markAO1Multiple choice
Answer
A
Mark scheme
November 2021 · Paper 1 · Q20(c)(ii)3 marksAO1Complete table/diagramMedium
Earlier parts of question 20 that this part uses
Mark scheme
Examiner's comment
Question 20(c): This question asked the candidate to calculate Kp.
Notes from the mark scheme and report
marked by column: Kp smaller/same/same
amount of NO2 smaller/greater/same
initial rate greater for all three
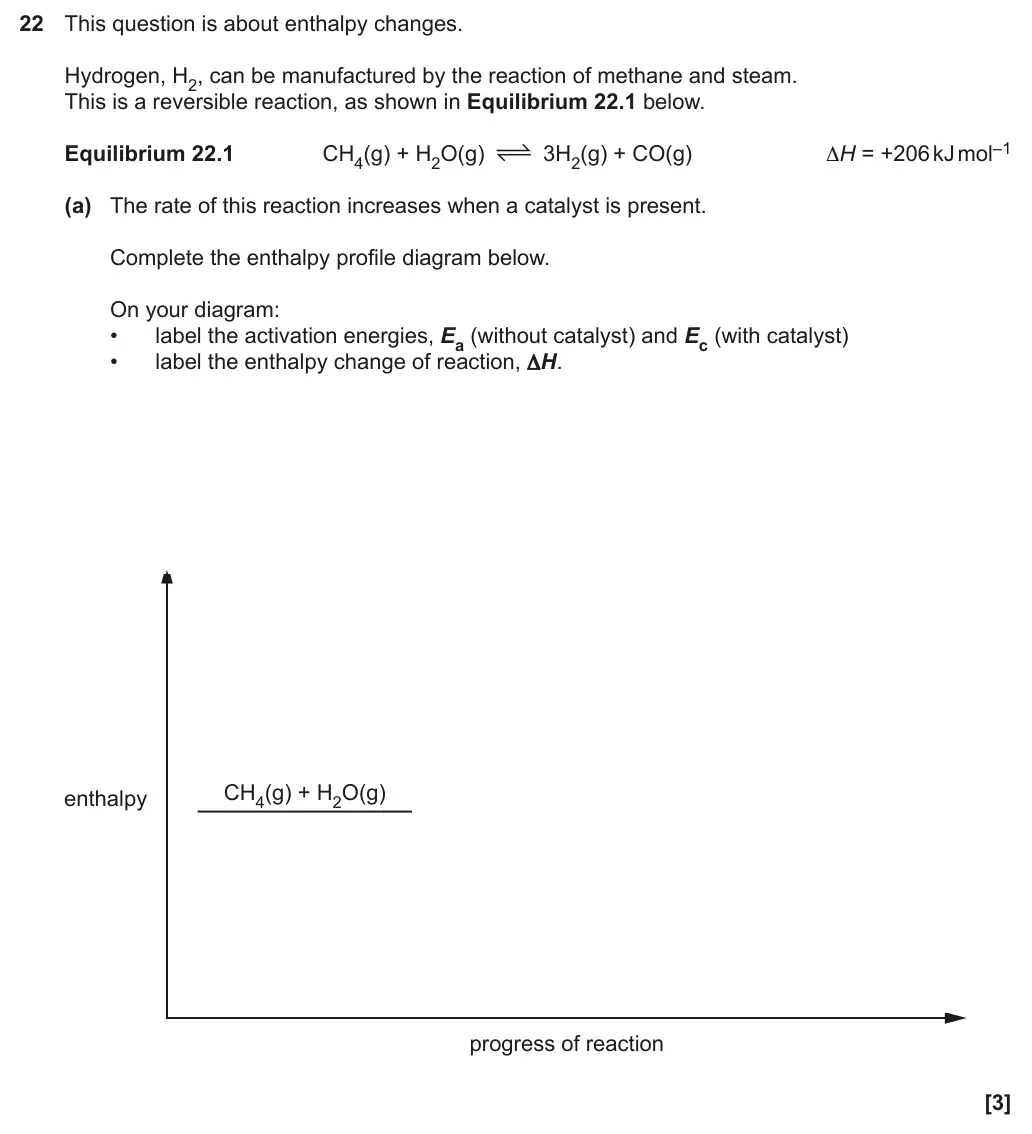
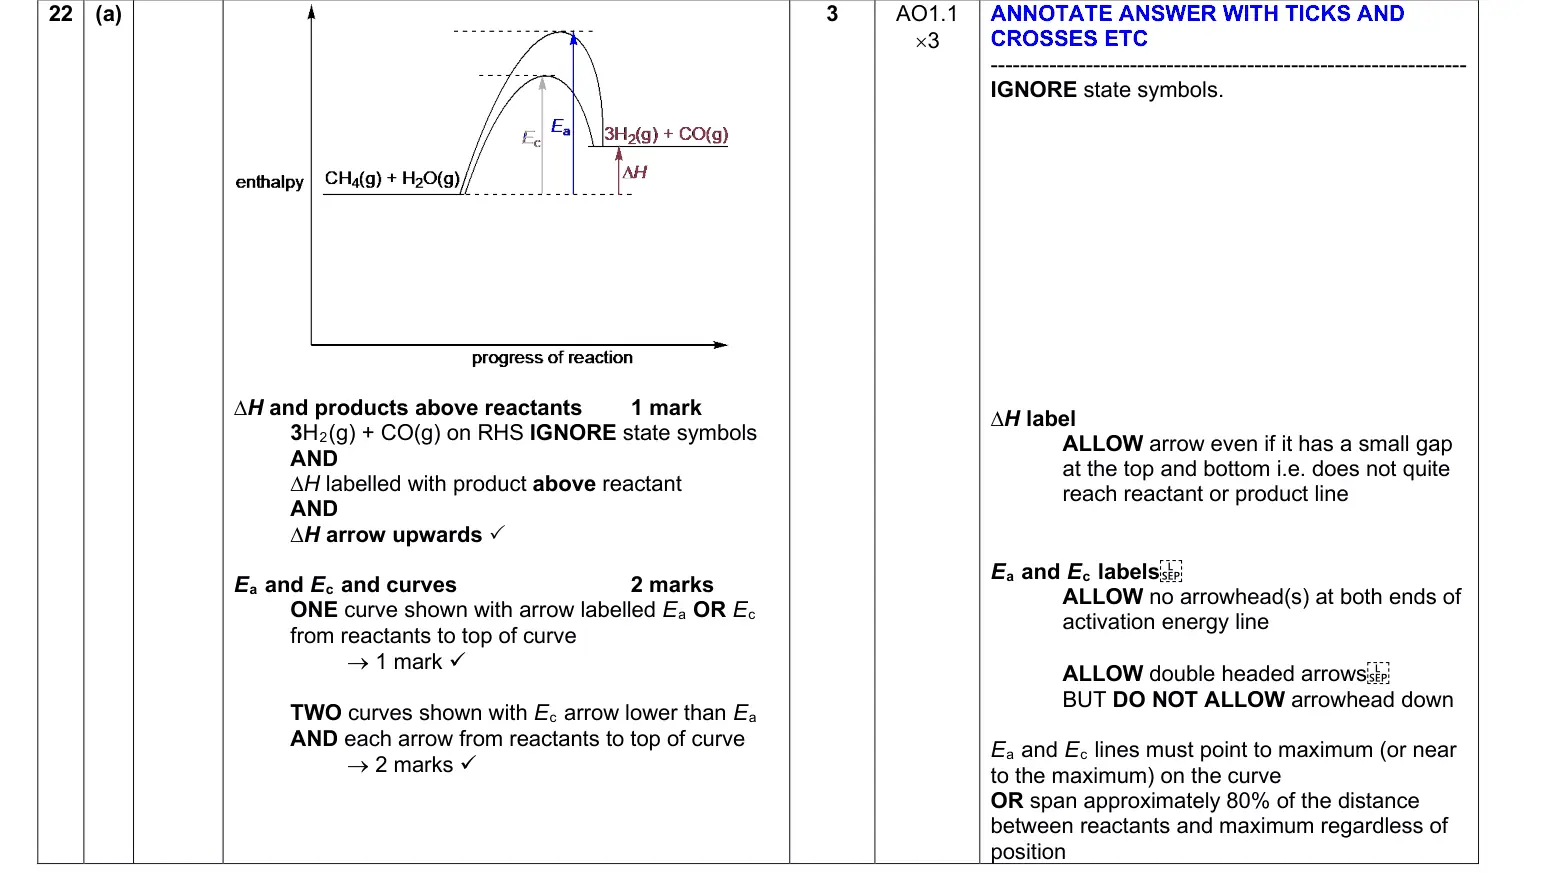
November 2021 · AS Paper 1 · Q22(a)3 marksAO1Complete table/diagram
Mark scheme
Notes from the mark scheme and report
products above reactants with ∆H arrow upwards
Ec arrow lower than Ea, both from reactants to top of curve
DO NOT ALLOW arrowhead down on Ea/Ec
IGNORE state symbols
Skills: M3.1 Translate information between graphical, numerical and algebraic forms
November 2021 · AS Paper 2 · Q5(c)2 marksAO3Short answer
Mark scheme
Notes from the mark scheme and report
less fossil fuel burned/less energy used
reduced CO2 emissions
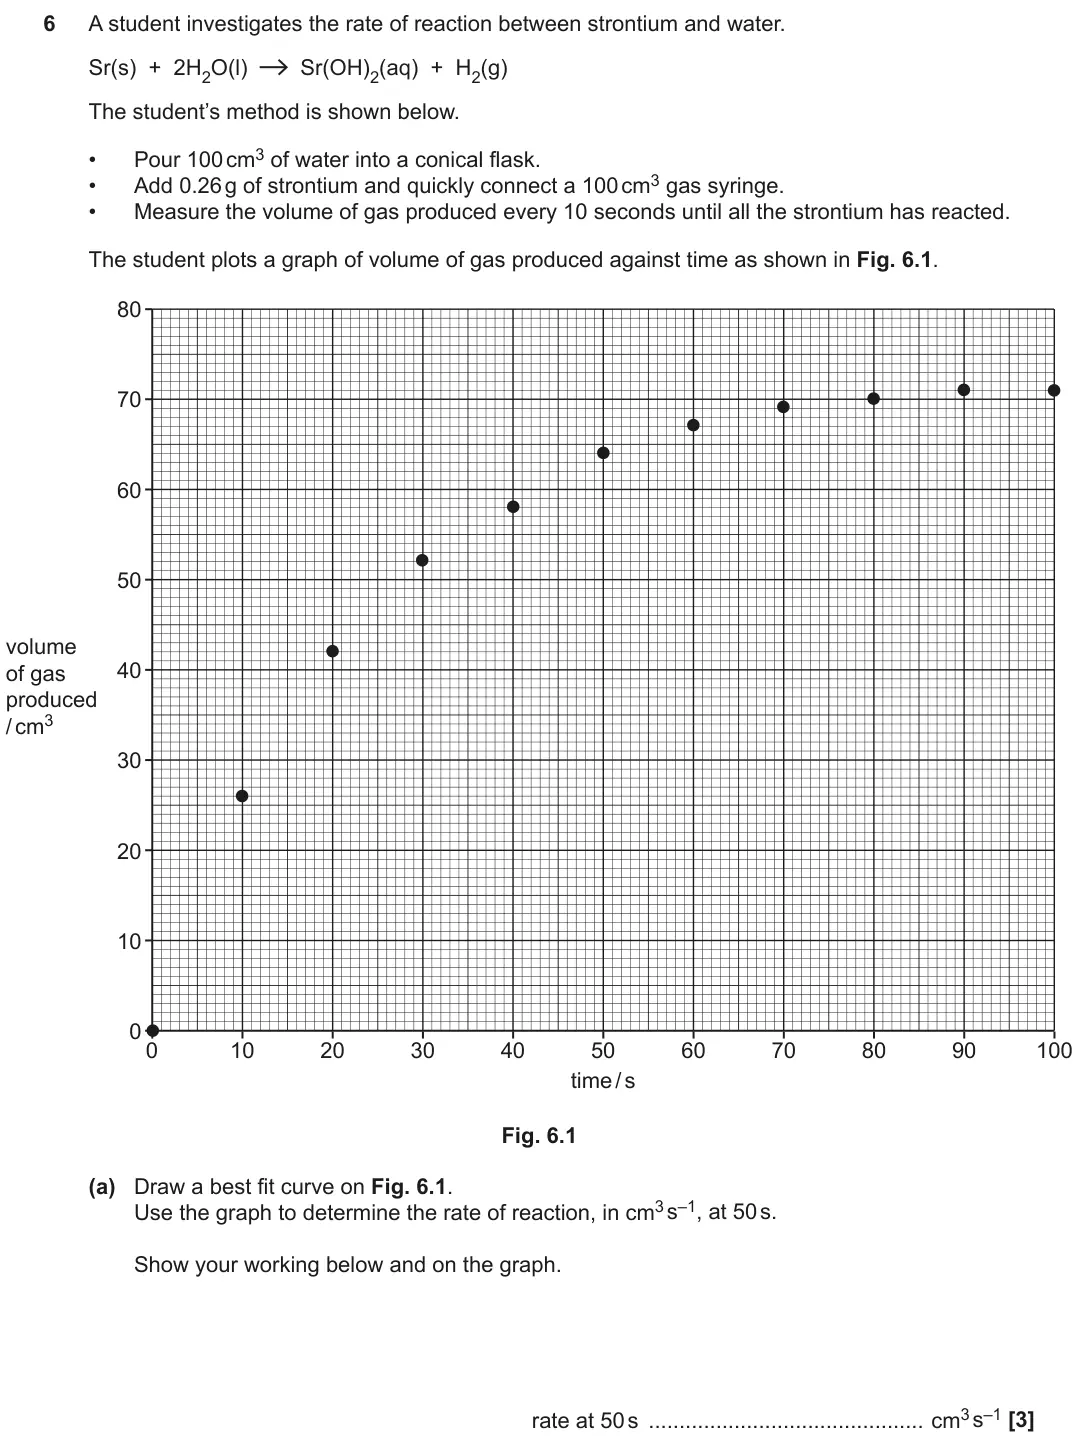
November 2021 · AS Paper 2 · Q6(a)3 marksAO1, 2Calculation
Mark scheme
Notes from the mark scheme and report
smooth best-fit curve
tangent at t = 50 s
gradient about 0.44 cm3 s–1
DO NOT ALLOW interpolation (direct reading from graph)
ALLOW ECF from incorrectly drawn tangent
Skills: M3.2 Plot two variables from experimental or other data; M3.5 Draw and use the slope of a tangent to a curve as a measure of rate of change; PAG9 Rates of reaction – continuous monitoring
November 2021 · AS Paper 2 · Q6(b)2 marksAO3Short answer
Earlier part of question 6 that this part uses
Mark scheme
Notes from the mark scheme and report
advantage: no loss of gas (before syringe connected)
disadvantage: loss in mass (of H2) very small for a 2 d.p. balance
IGNORE easier to set up
Skills: PAG9 Rates of reaction – continuous monitoring
November 2021 · AS Paper 2 · Q6(c)(ii)2 marksAO3Data interpretation
Earlier parts of question 6 that this part uses
Mark scheme
Notes from the mark scheme and report
steeper initial gradient and levels off earlier
same final volume of gas (same moles)
Skills: M3.1 Translate information between graphical, numerical and algebraic forms
November 2020 · Paper 1 · Q71 markAO1Multiple choice
Answer
D
Mark scheme
November 2020 · Paper 1 · Q17(b)2 marksAO1Short answer
Earlier part of question 17 that this part uses
Mark scheme
Notes from the mark scheme and report
lower temperature/energy demand
less fossil fuel burnt/less CO2
ALLOW reactions with greater atom economy/less waste
November 2020 · AS Paper 1 · Q24(b)5 marksAO1Extended responseMedium
Mark scheme
Examiner's comment
24(a) Most candidates were able to make some progress with the enthalpy calculation. Most recognised that the provided ∆cH values had to be multiplied by the balancing numbers in the equation. Most candidates processed the data on either side of the equation correctly and subtracted the combined enthalpy change from one side of the equation from the other, although the subtraction was sometimes the wrong way round. This resulted in answers of +92, or –92 kJ mol–1, with the exothermic value being correct. An enthalpy change of –92 kJ mol–1 was the commonest final answer, with comparatively few candidates recognising that the enthalpy change of formation of NH3 is for the formation of 1 mol of NH3 and not 2 mol as in the equation. 24(b) This question was well-answered showing that most candidates were well-acquainted with the Boltzmann distribution. Some candidates used one diagram to show the effect of increasing the temperature and of using a catalyst. Other candidates showed two curves, one for temperature, the other for the presence of a catalyst. Either approach could produce a clear response. Most candidates knew that the activation energy was lower with a catalyst that without. A significant number of candidates limited their explanations to ‘successful collisions’ without referring to more molecules exceeding the lower activation energy in the presence of catalyst or at a higher temperature. The best responses secured all five marks from a well-drawn and annotated graph supported by a brief explanation. Candidate should make full use of annotated diagrams to communicate their answers.
Notes from the mark scheme and report
curve starts near origin and must not touch x-axis
labels number of molecules AND energy (IGNORE atoms, enthalpy)
higher-T curve peak lower and to the right and must cross over
Ec shown below Ea on the distribution
IGNORE more successful/more frequent collisions
Skills: M3.1 Translate information between graphical, numerical and algebraic forms
June 2019 · AS Paper 1 · Q121 markAO1Multiple choiceMedium
Answer
C
Mark scheme
Examiner's comment
The role of activation energy in the rate of a reaction with increasing temperature was well-known and most candidates chose the correct option C. From the annotations on candidate scripts, many had ruled out options A and B entirely. D was anticipated as being the main distractor and this proved to be the case. Activation energy has a much greater effect than increasing collision frequency.
June 2019 · Paper 1 · Q19(c)(i)4 marksAO1Drawing / labellingEasy
Mark scheme
Examiner's comment
Most candidates were able to achieve all four marks. Occasionally candidates didn’t start their graph from zero or mislabelled the x-axis as ‘progress of reaction’.
Notes from the mark scheme and report
curve starts at origin and must not touch x-axis at high energy
axes number of molecules and energy (DO NOT ALLOW atoms or enthalpy)
DO NOT ALLOW two curves
Ec to the left of Ea
IGNORE more successful collisions
Skills: M3.1 Translate information between graphical, numerical and algebraic forms
June 2019 · Paper 1 · Q19(c)(ii)1 markAO1Short answerMedium
Earlier part of question 19 that this part uses
Mark scheme
Examiner's comment
The number of candidates who considered V2O5 to be a homogeneous catalyst was small.
Notes from the mark scheme and report
heterogeneous AND catalyst in a different phase/state from the reactants
June 2019 · AS Paper 2 · Q4(b)(i)1 markAO2Graph plottingMedium
Earlier parts of question 4 that this part uses
Mark scheme
Examiner's comment
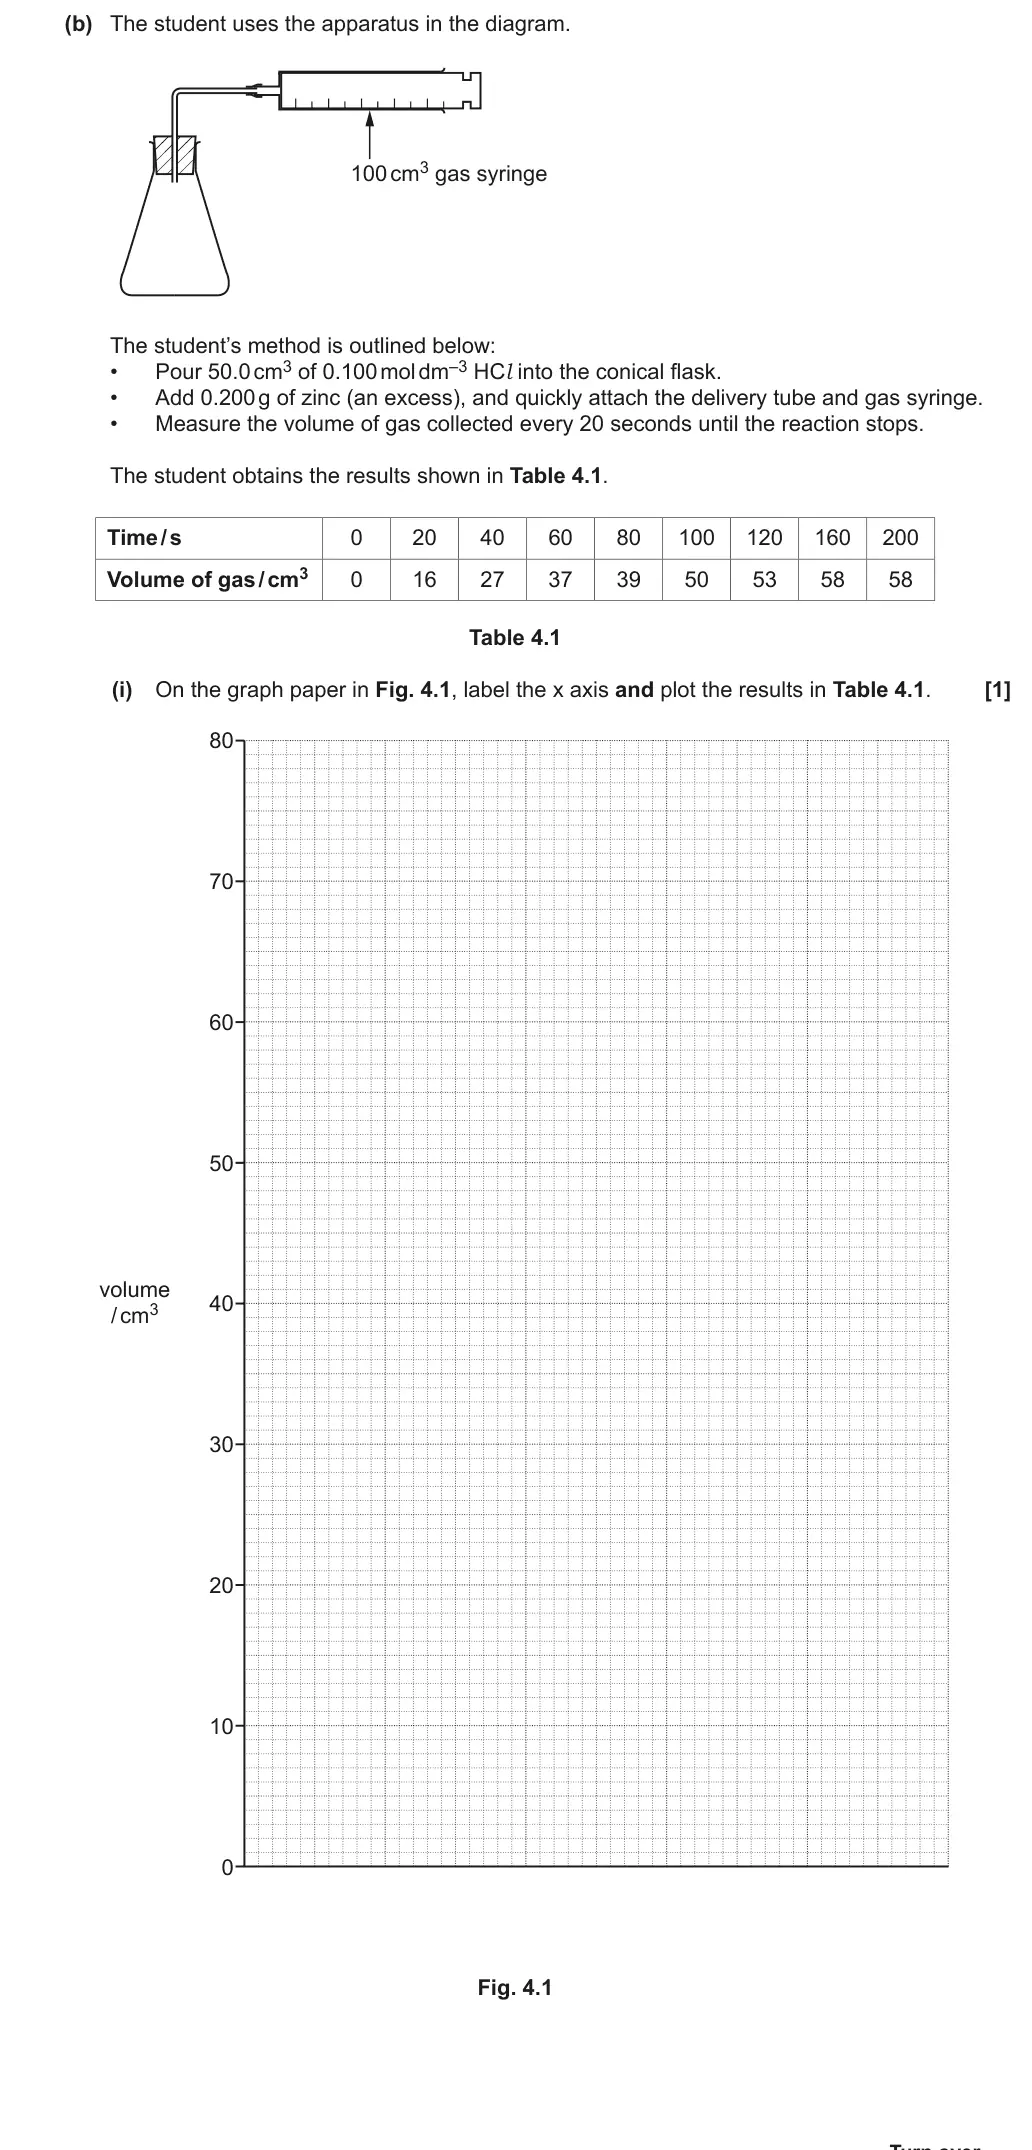
Most candidates obtained this mark, some lost the mark because they did not use a linear scale or provide units.
Notes from the mark scheme and report
linear x scale AND label Time / s AND points plotted ±1 small square
ALLOW up to 3 plotting errors
Skills: M3.2 Plot two variables from experimental or other data; PAG9 Rates of reaction – continuous monitoring
June 2019 · AS Paper 2 · Q4(b)(iii)1 markAO3Drawing / labellingEasy
Earlier parts of question 4 that this part uses
Mark scheme
Examiner's comment
Nearly all the candidates obtained this mark
Notes from the mark scheme and report
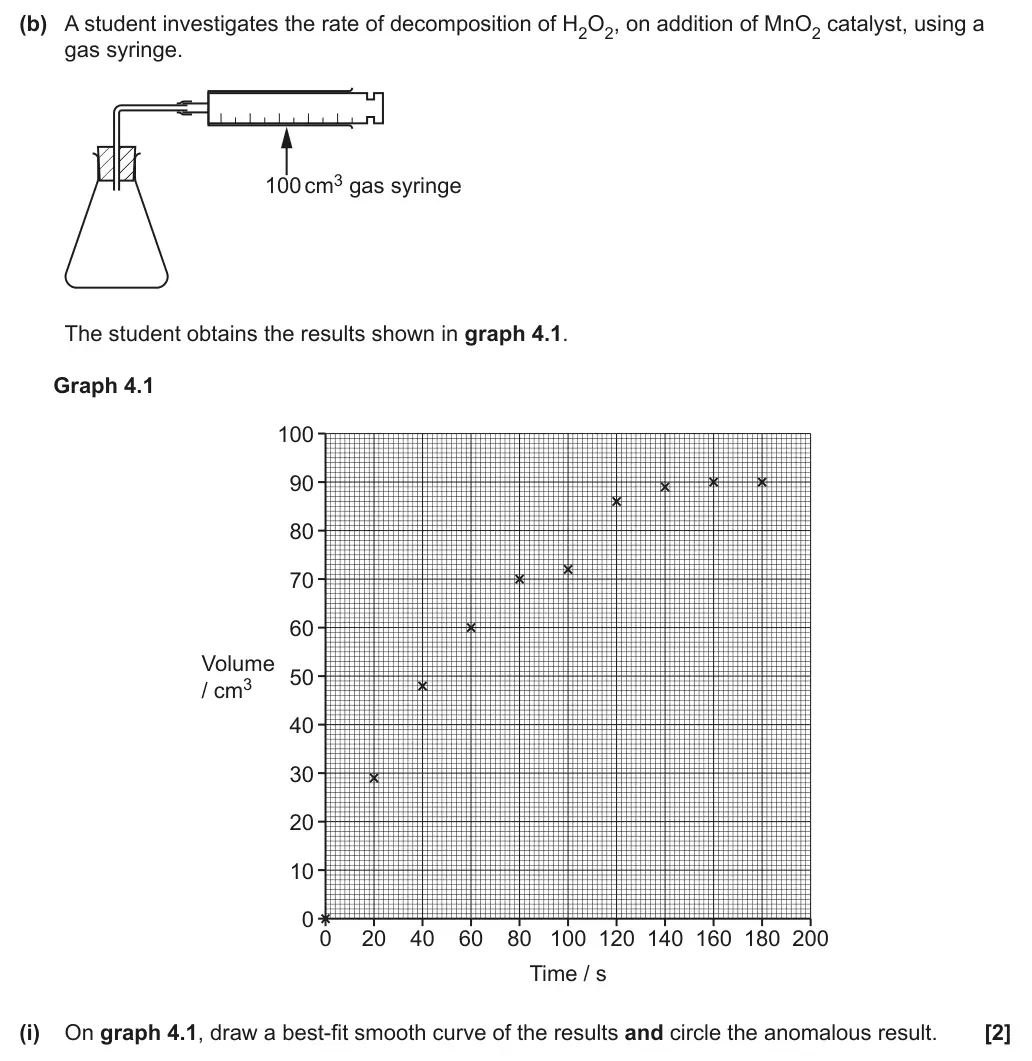
smooth curve through all points EXCEPT the 80 s point
Skills: M3.2 Plot two variables from experimental or other data; PAG9 Rates of reaction – continuous monitoring
June 2019 · AS Paper 2 · Q4(c)2 marksAO2Data interpretationMedium
Earlier parts of question 4 that this part uses
Mark scheme
Examiner's comment
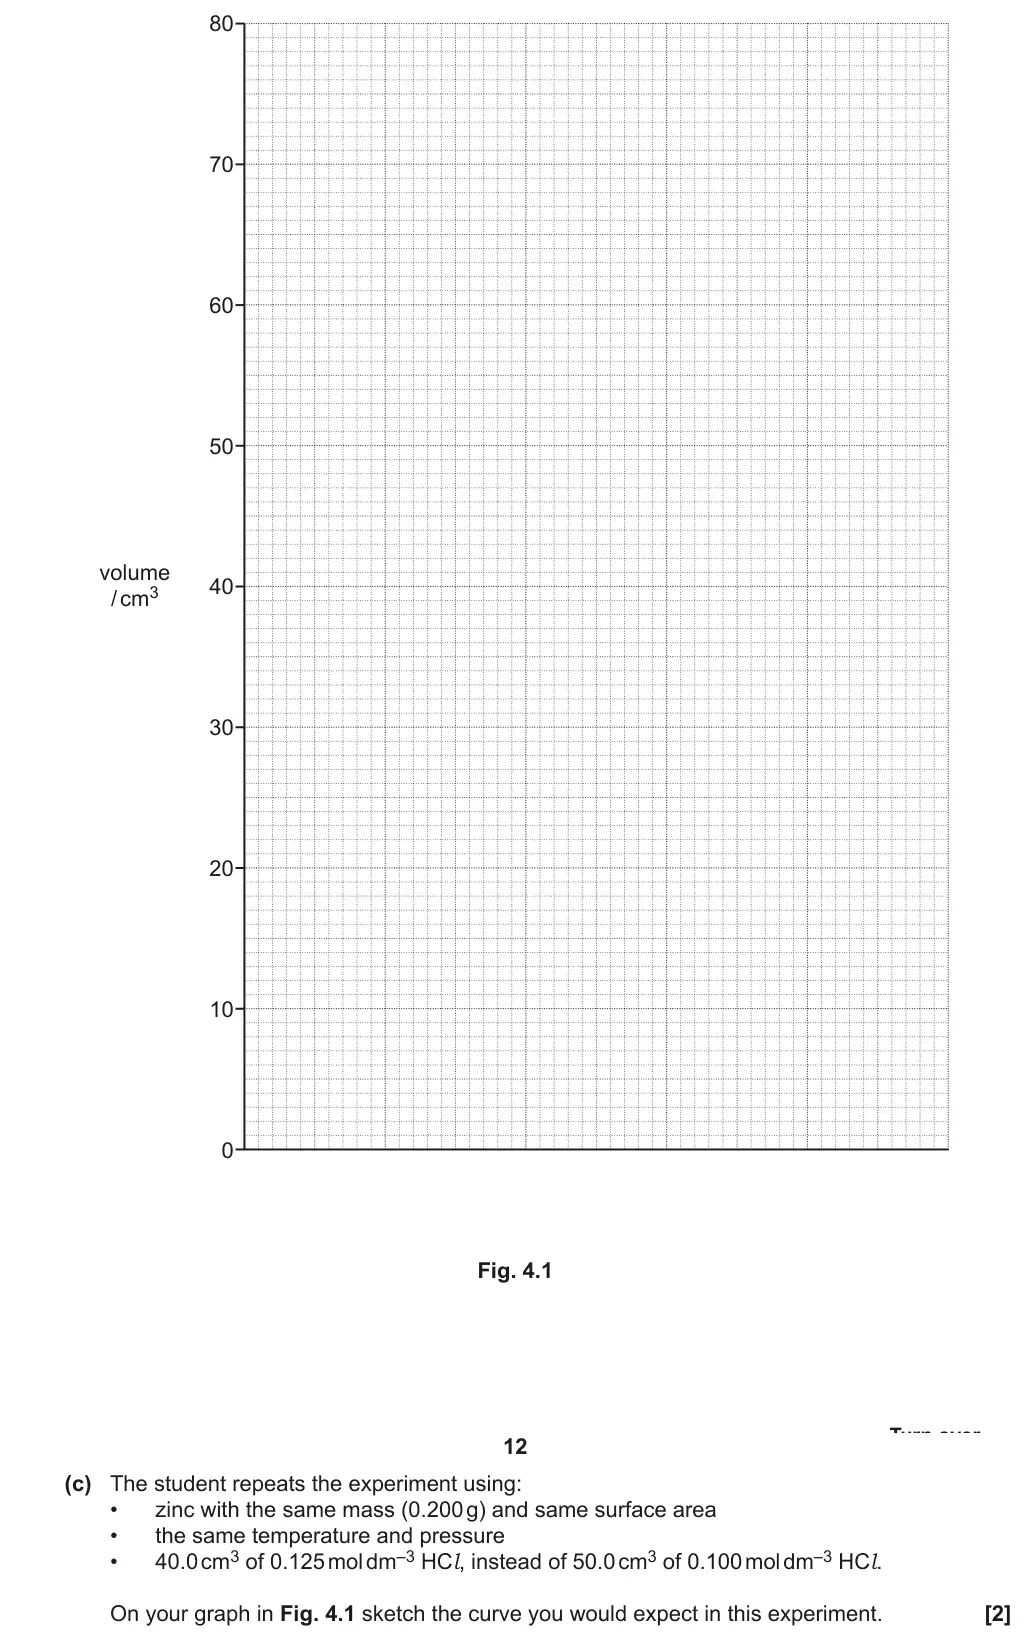
Many students did not sketch this curve or sketched a curved that was less steep and did not finish at 58cm3.
Notes from the mark scheme and report
steeper initial slope AND levels off earlier
same final volume (58 cm3) because same moles of HCl
Skills: M0.2 Use ratios, fractions and percentages; M3.1 Translate information between graphical, numerical and algebraic forms
June 2019 · AS Paper 2 · Q4(d)2 marksAO1Short answerMedium
Earlier part of question 4 that this part uses
Mark scheme
Examiner's comment
Many responses detailed why the graph was steep at the beginning, rather than answering the question. Those that did explain the decrease often omitted the words concentration and frequency so the majority did not gain 2 marks. A large number of candidates discussed particles “losing energy” and “less successful collisions” so were not given any marks.
Notes from the mark scheme and report
concentration of acid decreases (IGNORE amount decreases)
fewer collisions per second/less frequent - 'fewer collisions' alone insufficient
June 2019 · AS Paper 2 · Q4(e)(i)2 marksAO1Short answerEasy
Earlier part of question 4 that this part uses
Mark scheme
Examiner's comment
Most candidates scored the first marking point but many did not achieve the second marking point as their explanations were too vague.
Notes from the mark scheme and report
lowers activation energy by alternative route
greater proportion of molecules have energy ≥ Ea
IGNORE more successful collisions
June 2019 · AS Paper 2 · Q4(e)(ii)1 markAO2Short answerHard
Earlier part of question 4 that this part uses
Mark scheme
Examiner's comment
Almost half of the candidates answered this question correctly, the remainder did not realise that the question gave them the answer to the state that the copper sulphate solution was in. Many answers stated that it could be solid or aqueous, so difficult to classify.
Notes from the mark scheme and report
reactants are in different physical states - CuSO4(aq) same phase as acid but different from zinc
June 2018 · Paper 1 · Q141 markAO1Multiple choiceMedium
Answer
C
Mark scheme
Examiner's comment
This was almost universally correct.
June 2018 · Paper 1 · Q20(b)3 marksComplete table/diagramEasy
Mark scheme
Examiner's comment
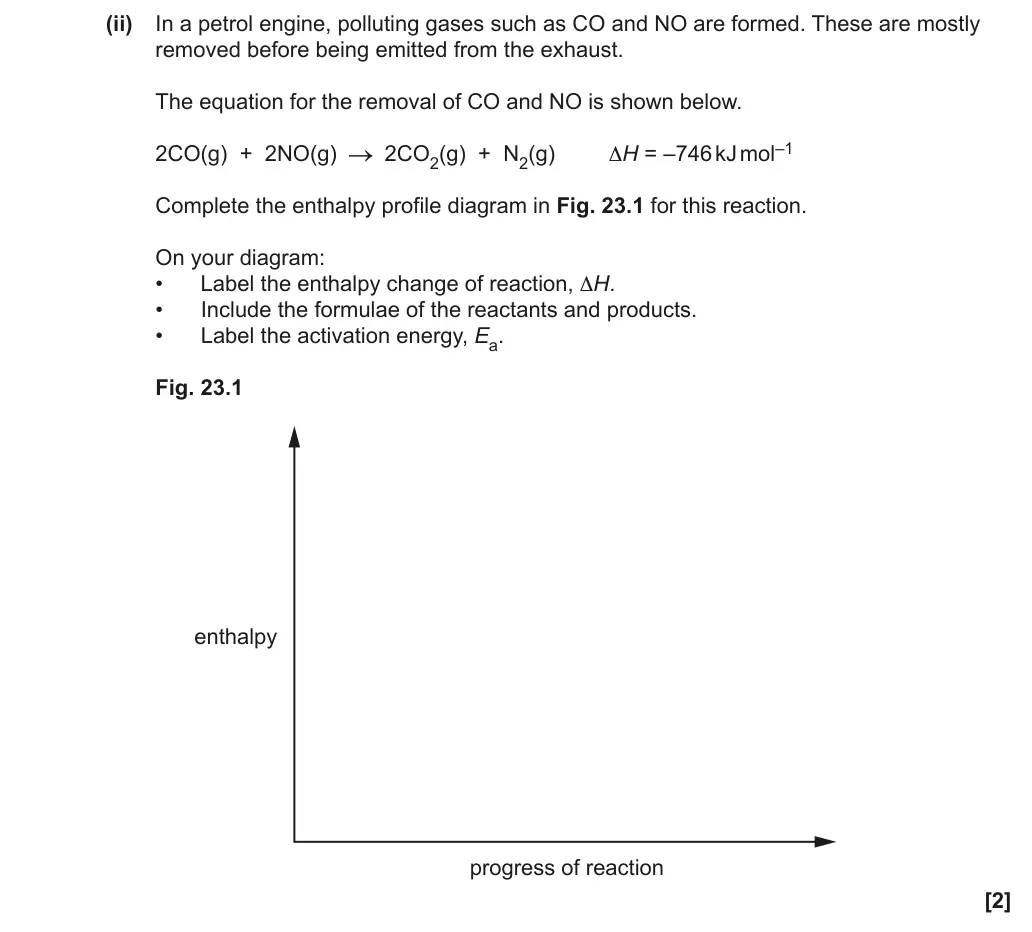
Apart from lower ability candidates, who opted to draw Boltzmann distributions, most candidates scored well here. Common errors included: omission of formulae of reactants and/or products; using a double-headed arrow for ∆H; and masking the lower part of the Ea line with the Ec line so it appeared that Ea was an additional energy increase above the Ec value.
Notes from the mark scheme and report
endothermic: products above reactants with ∆H arrow upwards
Ec below Ea, both from reactant level to their maxima
DO NOT ALLOW –∆H
exothermic diagram can still score first and third marks
Skills: M3.1 Translate information between graphical, numerical and algebraic forms
June 2018 · AS Paper 1 · Q23(b)4 marksDrawing / labellingEasy
Mark scheme
Examiner's comment
Overall, this question was answered well. Most candidates showed two Boltzmann distribution curves at different temperatures. Labelling of the axes was usually correct, although the labels were sometimes seen the wrong way around. Most candidates were aware that more molecules possessed the required activation energy at a higher temperature, although lower ability candidates discussed frequency of collisions instead. Strangely, many good responses were spoilt by not labelling which of the two curves was at higher temperature. This is shown in the otherwise excellent response in the exemplar.
Notes from the mark scheme and report
curve starts at origin and does not touch x axis
axes labelled number of molecules and energy
higher T peak lower and to the right
DO NOT ALLOW explanation using two activation energies
IGNORE more frequent collisions
Skills: M3.1 Translate information between graphical, numerical and algebraic forms
June 2018 · AS Paper 2 · Q4(c)5 marksExtended responseEasy
Earlier part of question 4 that this part uses
Mark scheme
Examiner's comment
Most candidates answered this question very well, with the most common mark being 4/5. Many candidates put a lot of effort into explaining, in depth, Le Chatelier’s principle, which was not required. The first three marking points were credited to most candidates. Responses were confident in their descriptions of equilibrium shifts and many candidates then went on to qualify their answers with operational factor considerations and/or rate. The explanation for pressure was described less commonly than temperature and many candidates did not appreciated that increased rate would lead to a decreased equilibrium yield. This candidate scored all five marks for this well-reasoned approach to the question.
Notes from the mark scheme and report
low temperature (exothermic) and low pressure (fewer gaseous moles on left)
compromise must relate temperature/pressure to rate
IGNORE catalyst and stated values
June 2018 · AS Paper 2 · Q5(b)2 marksCalculationMedium
Mark scheme
Examiner's comment
Most candidates knew they had to draw a tangent to the curve but calculating the gradient led to careless errors. Many drew tiny triangles and mis-read readings of coordinates. It is far easier, and more accurate, to use large triangles using the axes for coordinates. Lower ability candidates just interpolated the graph at 30s and were not credited marks for this.
Notes from the mark scheme and report
tangent drawn at t = 30 min (±10)
DO NOT ALLOW interpolation (direct reading)
ALLOW ECF from incorrect tangent
IGNORE units and sign
Skills: M3.1 Translate information between graphical, numerical and algebraic forms; M3.5 Draw and use the slope of a tangent to a curve as a measure of rate of change
June 2018 · Paper 3 · Q2(a)(i)5 marksCalculationEasy
Mark scheme
Examiner's comment
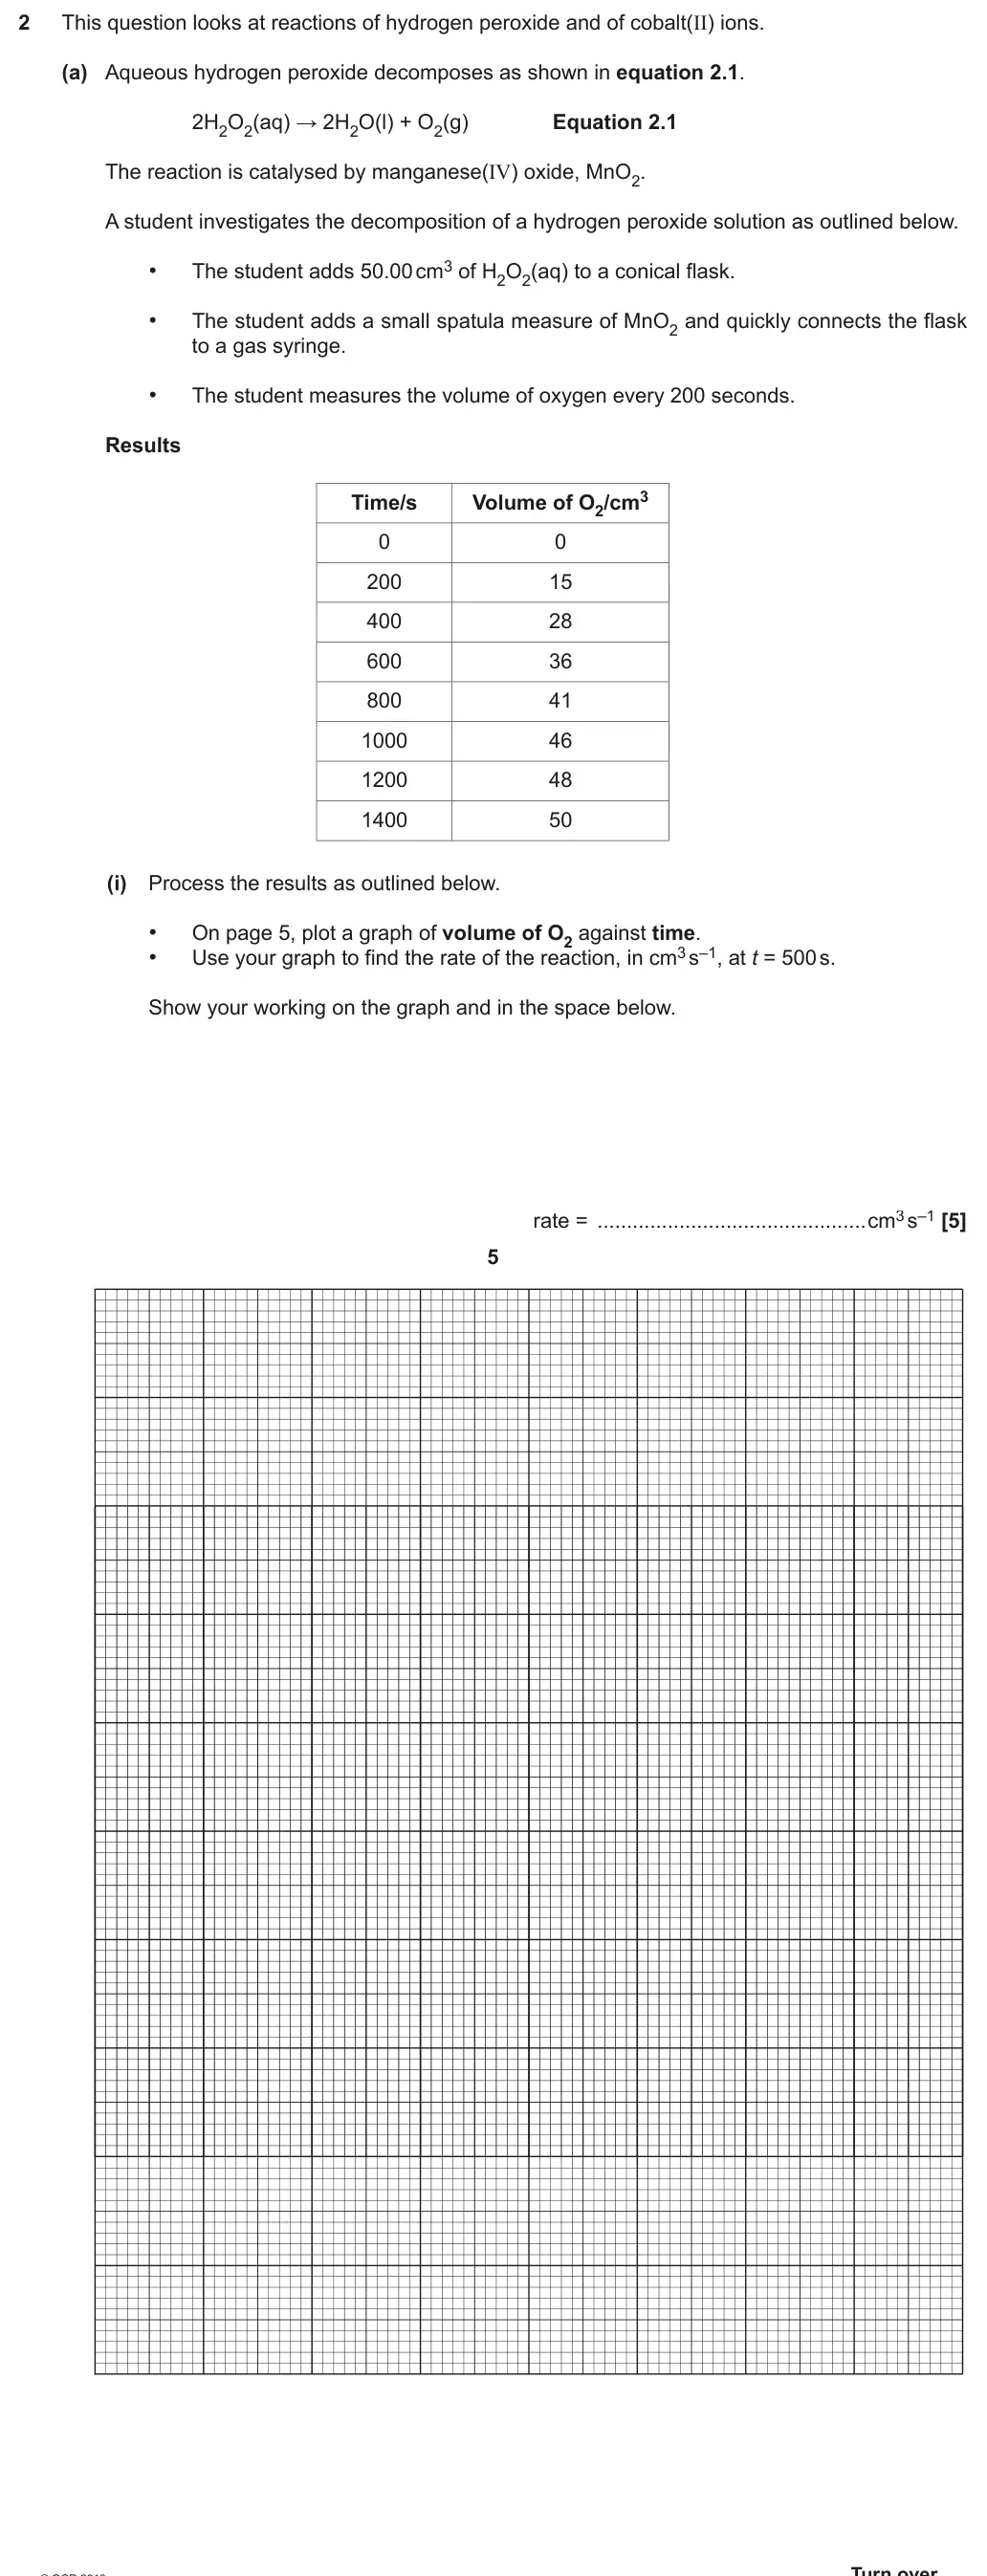
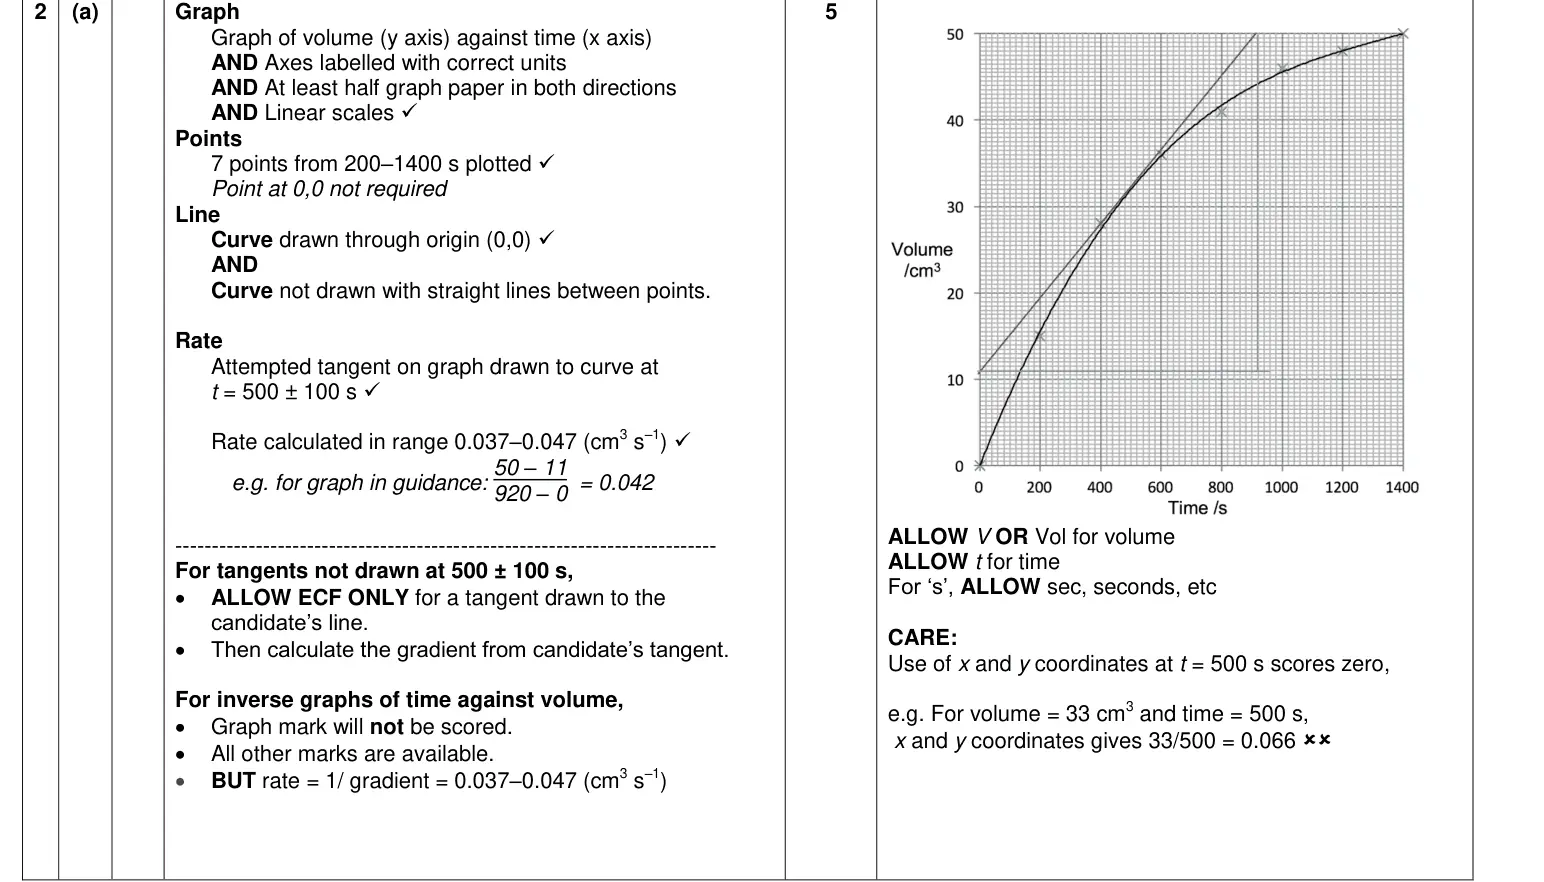
The graph was generally well drawn although many didn’t realise that a tangent needed to be drawn. A few tried to draw a straight line of best fit, rather than a curve. Most candidates were able to construct a correct graph, assigning the axes correctly and making good use of the graph paper. Points were usually plotted correctly and most candidates made a good attempt to draw a curved line of best fit. Candidates then needed to draw a tangent at 500 seconds and to measure its gradient to calculate the rate. Lower ability candidates did not draw a tangent to their curve and just calculated the volume formed at 500 seconds.
Notes from the mark scheme and report
axes labelled with units, linear scales using at least half the grid
smooth curve through origin not point-to-point lines
tangent at t = 500 ± 100 s
rate 0.037–0.047
using x and y coordinates at 500 s (33/500 = 0.066) scores zero
Skills: M3.1 Translate information between graphical, numerical and algebraic forms; M3.2 Plot two variables from experimental or other data; M3.5 Draw and use the slope of a tangent to a curve as a measure of rate of change; PAG9 Rates of reaction – continuous monitoring
June 2017 · Paper 1 · Q19(b)1 markShort answer
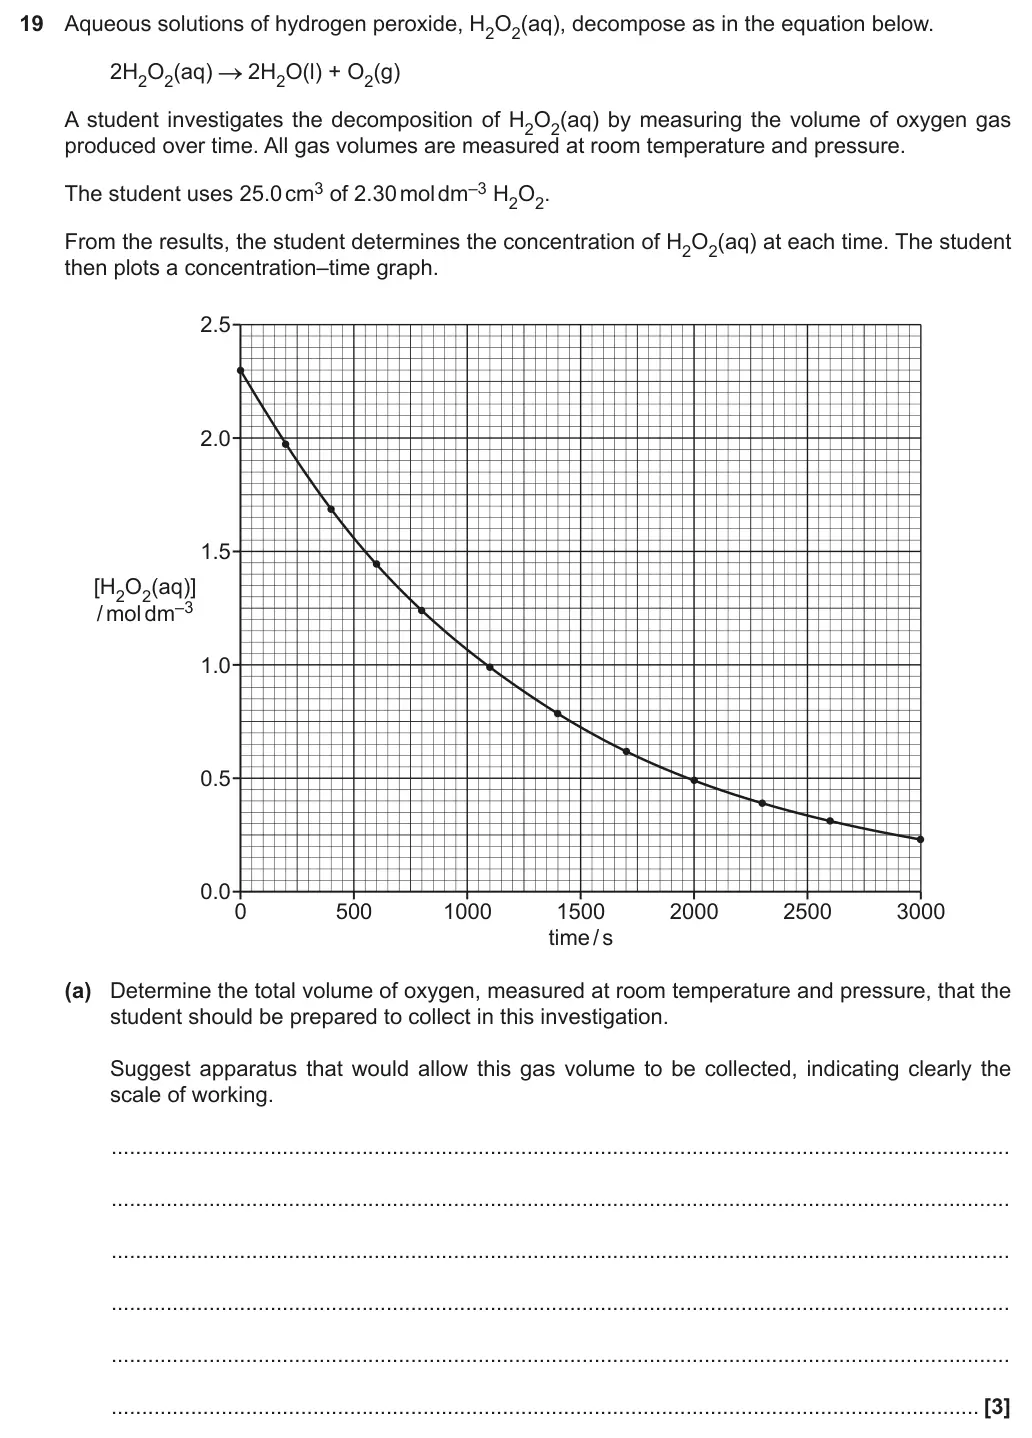
Earlier part of question 19 that this part uses
Mark scheme
Notes from the mark scheme and report
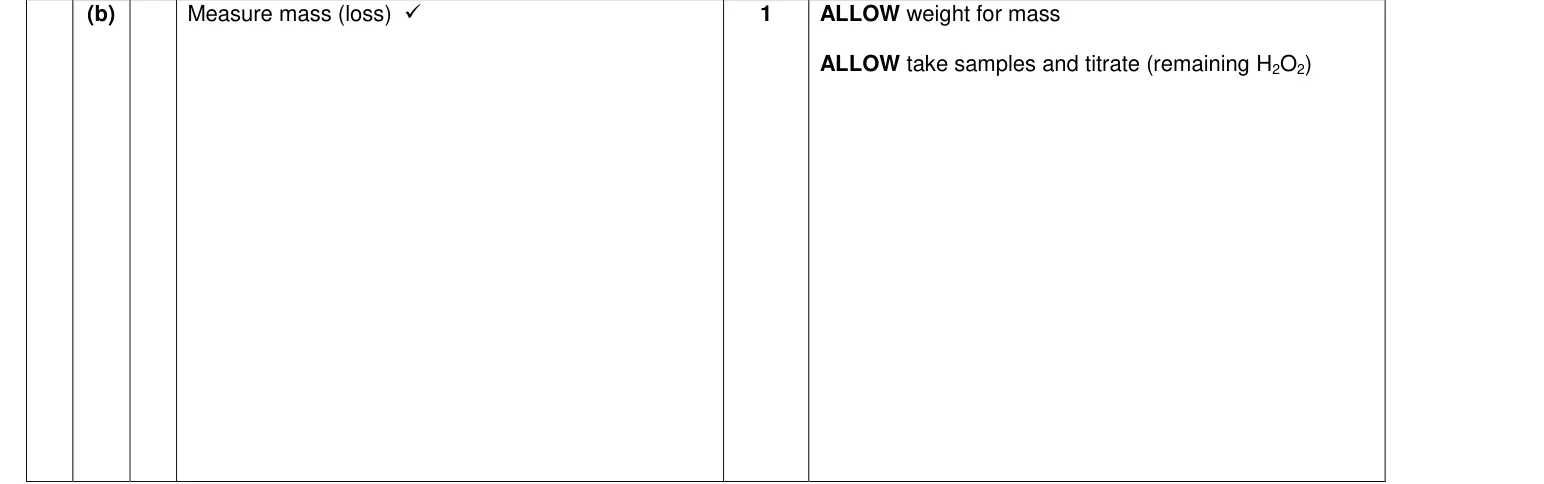
measure mass loss
ALLOW take samples and titrate remaining H2O2
Skills: PAG9 Rates of reaction – continuous monitoring
June 2017 · AS Paper 1 · Q23(a)4 marksShort answer
Mark scheme
Notes from the mark scheme and report
curve starts near origin and must not touch x-axis at high energy
DO NOT ALLOW two curves (confusion with temperature)
DO NOT ALLOW 'atoms' as y-axis label or 'enthalpy' for x-axis
IGNORE more successful collisions
Skills: M3.1 Translate information between graphical, numerical and algebraic forms
June 2017 · AS Paper 1 · Q23(b)2 marksShort answer
Mark scheme
Notes from the mark scheme and report
two from lower temperature/less heat, less fossil fuel burnt, less CO2
IGNORE just 'less fuel', less energy, lower pressure, less global warming
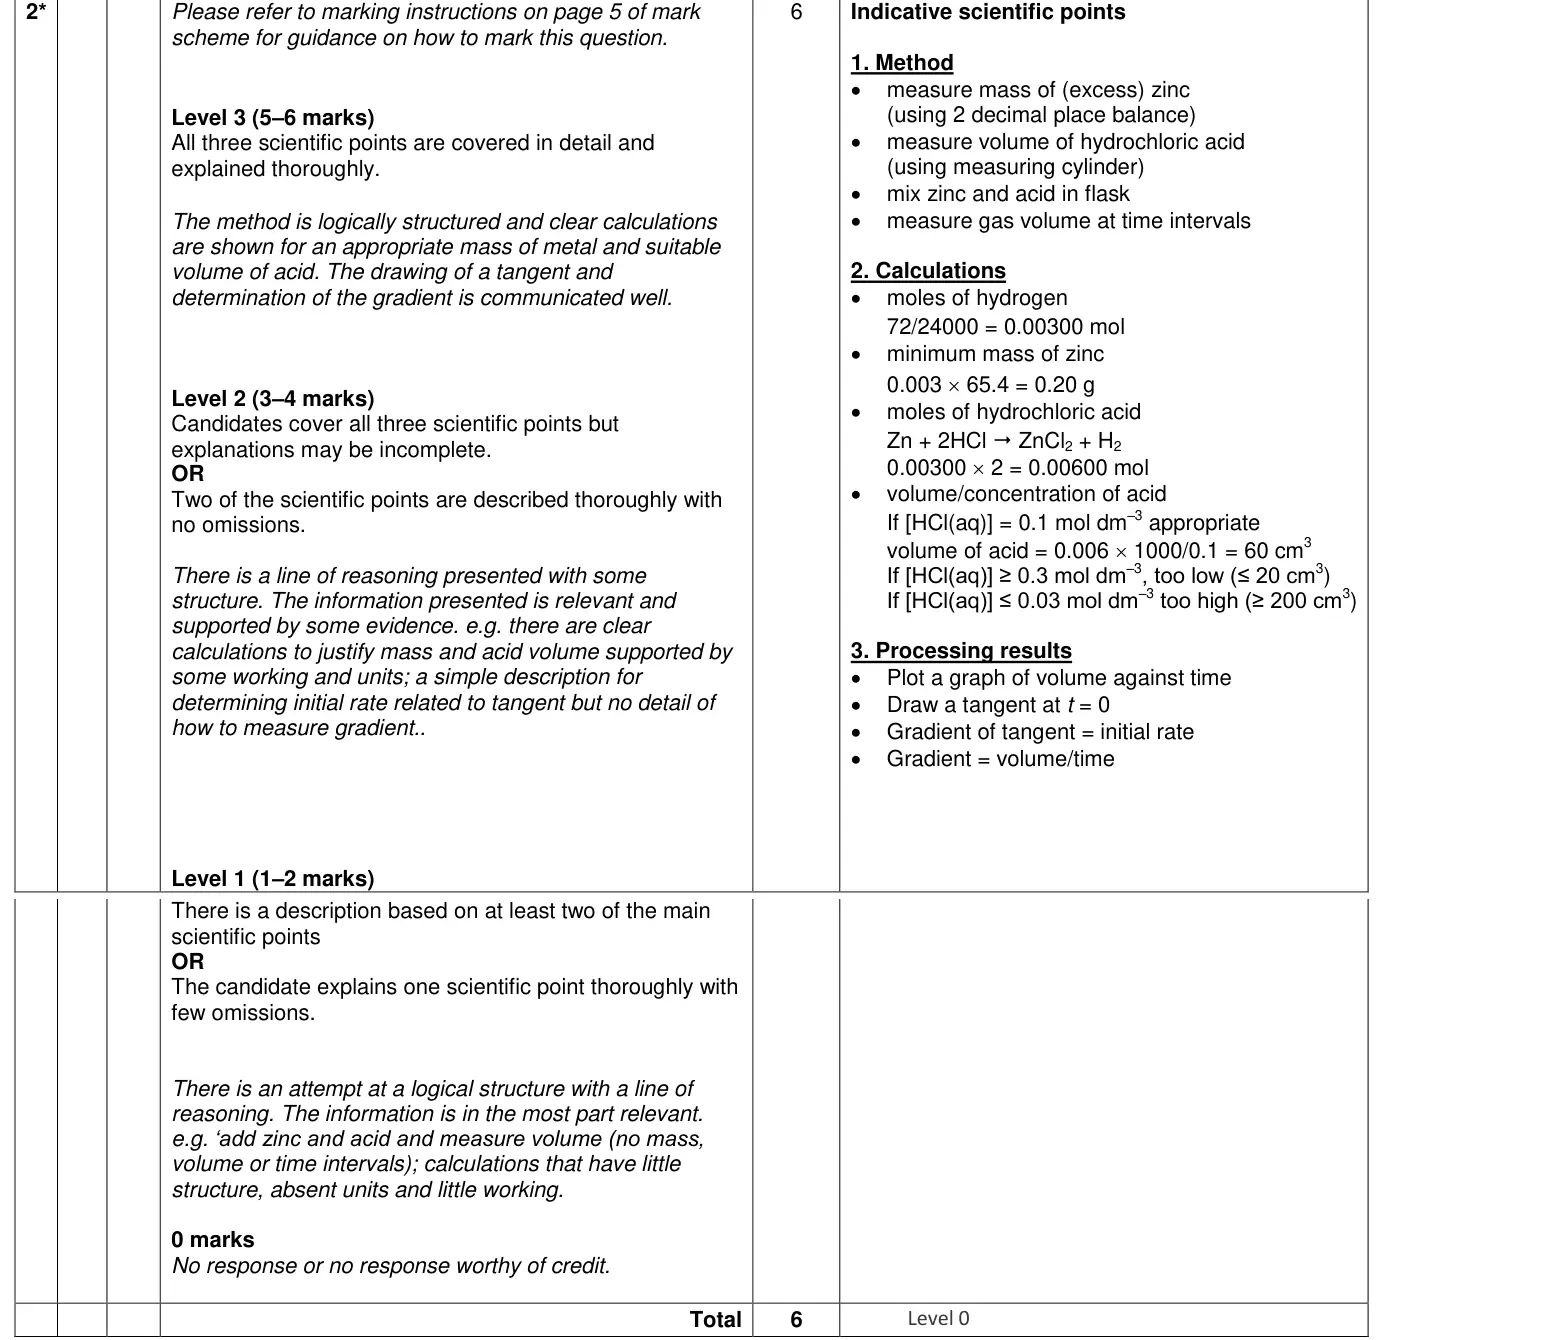
June 2017 · AS Paper 2 · Q26 marks6-mark level of response
Mark scheme, with the levels and indicative points
Notes from the mark scheme and report
72/24000 = 0.00300 mol H2 so minimum 0.20 g Zn and 0.00600 mol HCl
acid volume must suit the apparatus (e.g. 60 cm3 of 0.1 mol dm–3)
plot volume against time, tangent at t = 0, gradient = initial rate
Skills: M0.2 Use ratios, fractions and percentages; M2.3 Substitute numerical values into algebraic equations using appropriate units for physical quantities; M3.2 Plot two variables from experimental or other data; M3.5 Draw and use the slope of a tangent to a curve as a measure of rate of change; PAG1 Moles determination; PAG9 Rates of reaction – continuous monitoring
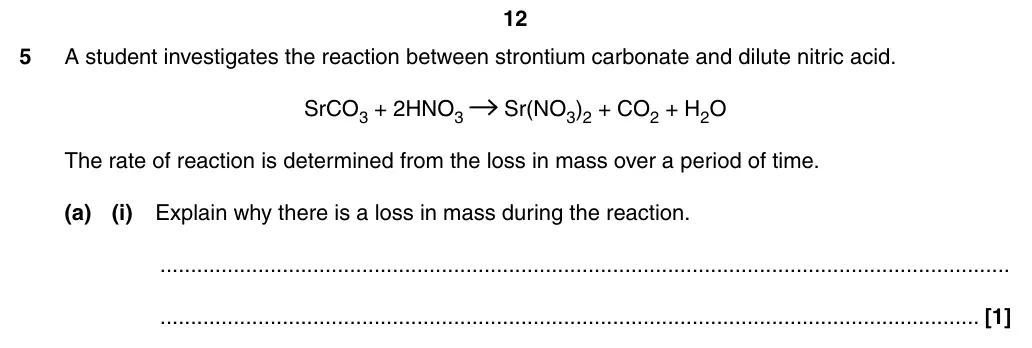
June 2016 · AS Paper 2 · Q5(a)(i)1 markAO3Short answer
Mark scheme
Notes from the mark scheme and report
CO2 lost as a gas
DO NOT ALLOW water/steam or 'CO2 evaporates'
Skills: PAG9 Rates of reaction – continuous monitoring
June 2016 · AS Paper 2 · Q5(b)(i)2 marksAO2Short answer
Earlier part of question 5 that this part uses
Mark scheme
Notes from the mark scheme and report
rate decreases AND concentration decreases
less frequent collisions/fewer per unit time
IGNORE 'less collisions' and 'less successful collisions'
Skills: M3.1 Translate information between graphical, numerical and algebraic forms
June 2016 · AS Paper 2 · Q5(b)(ii)2 marksAO3Calculation
Earlier parts of question 5 that this part uses
Mark scheme
Notes from the mark scheme and report
tangent must be drawn at t = 200 s
answer in range 5 × 10^-4 to 8 × 10^-4
IGNORE units and sign
Skills: M3.1 Translate information between graphical, numerical and algebraic forms; M3.5 Draw and use the slope of a tangent to a curve as a measure of rate of change
June 2016 · AS Paper 2 · Q5(c)3 marksAO3Short answer
Earlier parts of question 5 that this part uses
Mark scheme
Notes from the mark scheme and report
flask or beaker AND balance AND timer
record mass at time intervals
interval of 10–50 s quoted
DO NOT ALLOW round-bottomed flask
IGNORE weighing scales
Skills: PAG9 Rates of reaction – continuous monitoring
Work with an OCR chemistry tutor
Dropping marks on calculations, mechanisms or the six-markers? Book a trial session with a specialist OCR chemistry tutor.